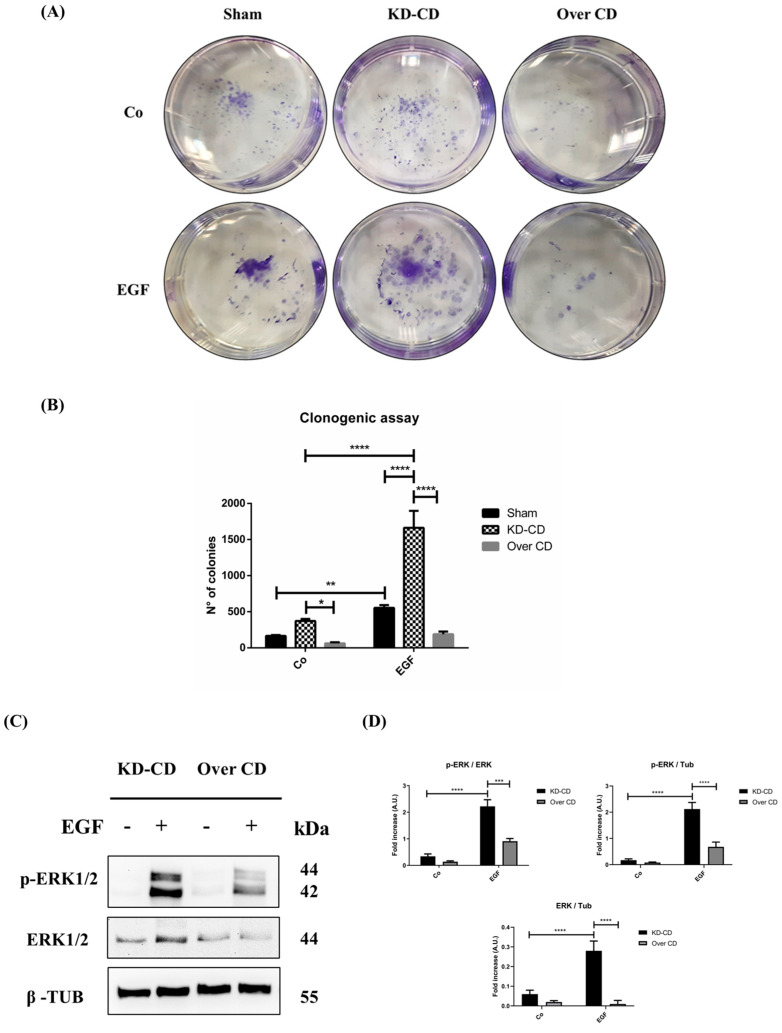
Figure 6.
EGF stimulation of neuroblastoma growth depends on cellular level of cathepsin D. (A) Clonogenic assay performed on SH-SY5Y transgenic clones upon stimulation with 20 ng/mL EGF. Colonies were stained as described in the Methods section. (B) Cell growth and number of colonies were estimated through photometric measurements and CellCounter Software and are shown in the graph. Data ± S.D. are representative of three independent replicates. (C) Western blotting showing the phosphorylation of ERK 1/2 (p-ERK 1/2) in KD-CD and Over CD cells treated with EGF. Cells were cultured for 72 h; medium was renewed and EGF re-added every day. Samples were processed for Western blot analysis of p-ERK and total ERK. Membranes were probed with β-tubulin as loading control. All blots are representative of three independent experiments. (D) Densitometry of the p-ERK/ERK, p-ERK/Tubulin and ERK/Tubulin ratios are reported in the histograms. Two-way ANOVA test was performed in all the statistical analysis reported in the figure. Significance was considered as follows: **** p < 0.0001; *** p < 0.001; ** p < 0.01; * p < 0.05. “Co” refers to untreated cells (control).

