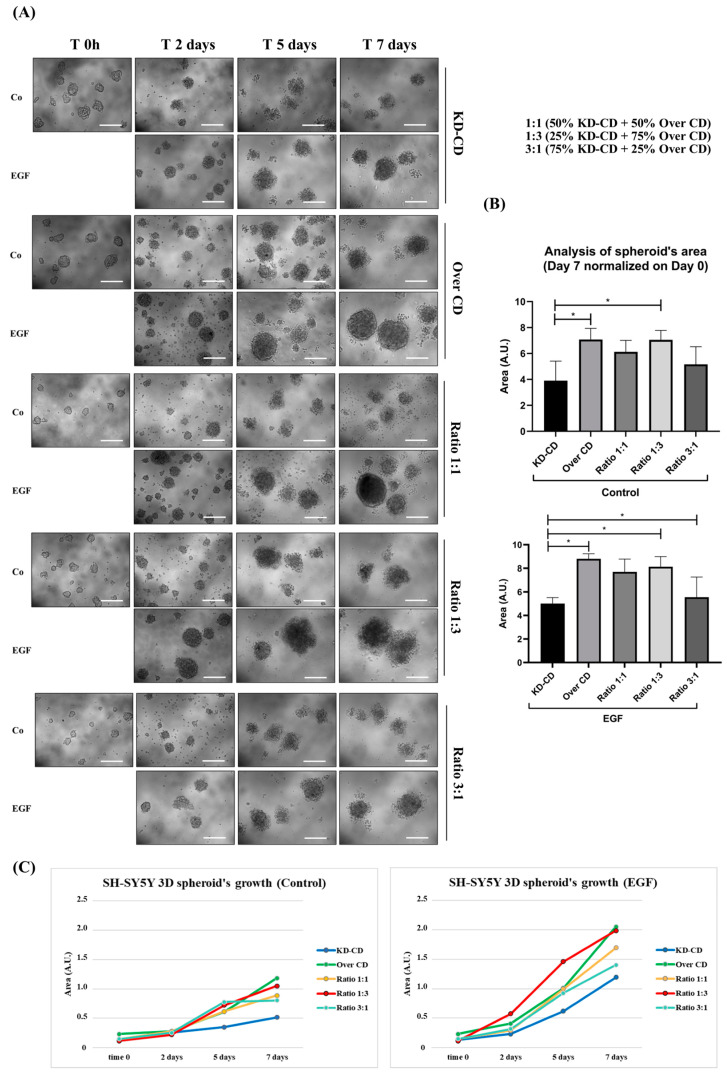
Figure 9.
Monitoring of spheroid’s formation in pure and mixed clones co-cultured in the absence or presence of EGF. SH-SY5Y KD-CD, Over CD and co-cultures (50% KD-CD + 50% Over CD cells (1:1), 25% KD-CD + 75% Over CD (1:3) and 75% KD-CD + 25% Over CD cells (3:1)) were plated on non-adherent Petri dishes and allowed to grow for 48 h to allow spheroid formation. Cells were cultured for 7 days after the first treatment. At time 0h, cells were incubated with EGF and re-treated in fresh medium at days 2 and 5 until the endpoint of 7 days. (A) The 3D spheroid’s growth was monitored at the phase-contrast microscope and images were acquired at different time points (time 0 h, 2-, 5- and 7-days). Scale bar = 100 μm; magnification = 20×. (B) Quantification of spheroid’s size was obtained through ImageJ software (v.1.48). The area is indicated as arbitrary unit (A.U.). Data represent the average ± S.D., calculated for at least 5 to 10 spheroids for each condition in three separate experiments. Graphs show the statistically significant differences in spheroid area detected at time day 7 (endpoint) normalized at time 0 h. One-way ANOVA test was performed. Significance was considered as follows: * p < 0.05. (C) Graphs representing the increasing growth of spheroids in control and EGF-treated conditions. The area is indicated as arbitrary unit (A.U.).

