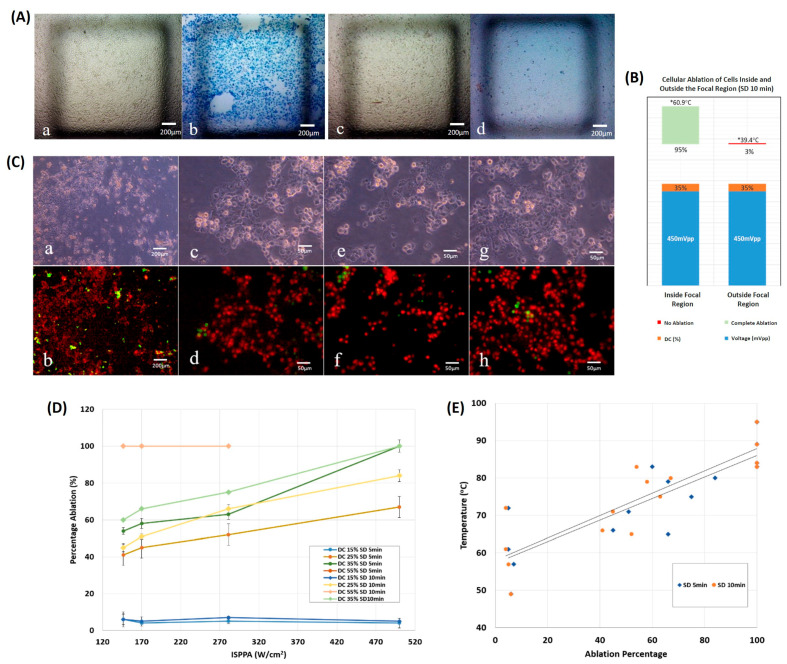
Figure 5.
Monolayer ultrasonic ablation. (A) Bright field images, (a,b) cells located inside the focal region, pre-sonication and post-sonication, respectively, with dead cells stained in blue. (c,d) cells located outside the focal region, pre-sonication and post-sonication, respectively. (B) Ablation percentage following 10 min of sonication. The ablation area is greater than 95% inside the focal region, whereas it is in the vicinity of zero outside the focal region. (C) Bright field images of cells post sonication at (a) 5× magnification and at 20× magnification (c,e,g). Fluorescent images of cells at (b) 5× magnification and at 20× magnification (d–h). Results show 99% ablation where alive cells are stained in green, while dead cells are stained in red. (D) Percentage ablation of monolayers as a function of acoustic intensity at distinct DC and SD. (DC = 15, 25, 35 or 55%, SD = 5 or 10 min. (E) Final temperature versus ablation percentage of monolayers following ultrasound sonication for 5 or 10 min.

