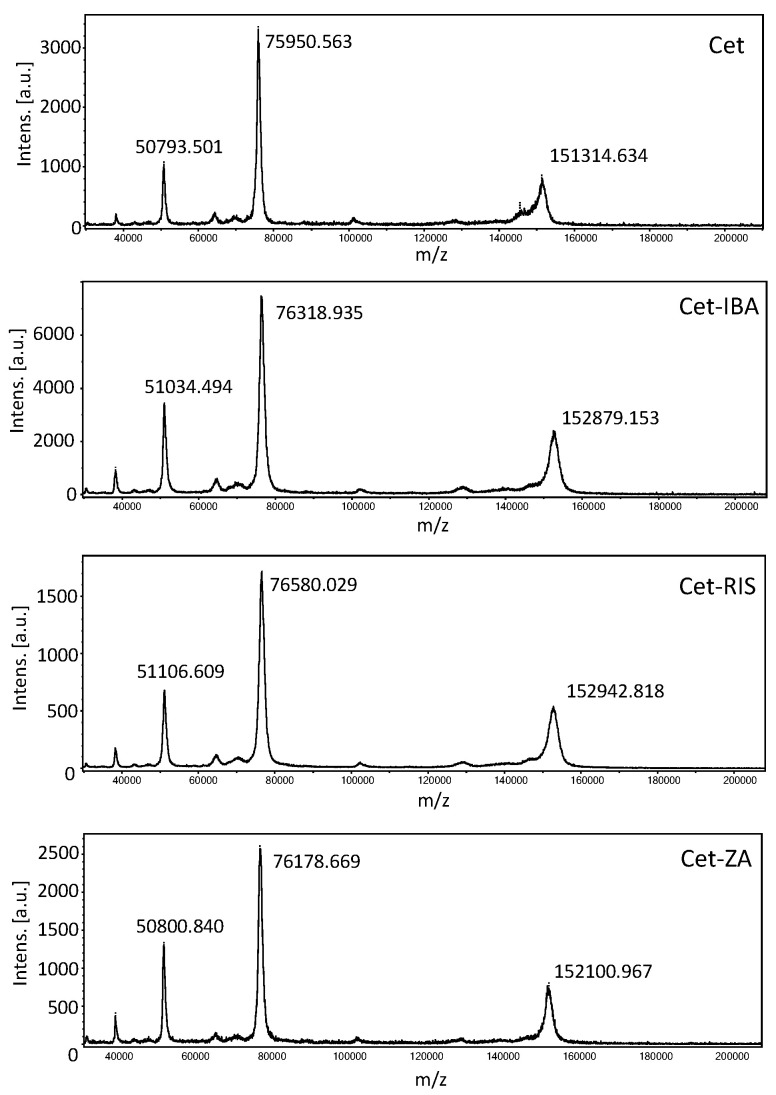
Figure 2.
Matrix-assisted laser desorption ionization (MALDI) mass spectra of Cetuximab (top), Cet-IBA, Cet-RIS, and Cet-ZA ADCs (bottom) in order. In each panel, the molecular weight (MW) of singlet, doublet, and triplet ionized molecules are shown. The differences in MW are the evidence of the covalent conjugation of each N-BPs to the antibody Cet. The MALDI spectrum for native Cet is shown in the first panel.

