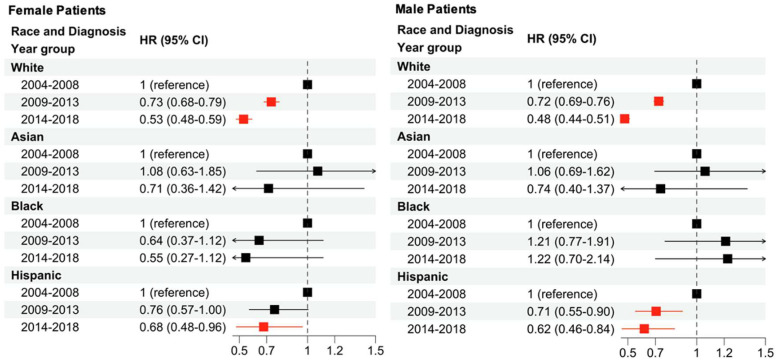
Figure 3.
Multivariable Cox regression analysis to examine changes in CSS due to sex, race/ethnicity, and year of diagnosis. The baseline hazard is a diagnosis from 2004 to 2008, stratified by race and sex. Arrows indicate that the full confidence interval is not shown in the graphical depiction of the HR and 95% CI. Red squares indicate significance (p < 0.05) while black squares are not significant.

