
Figure 2. RF remapping in the LIP and FEF.
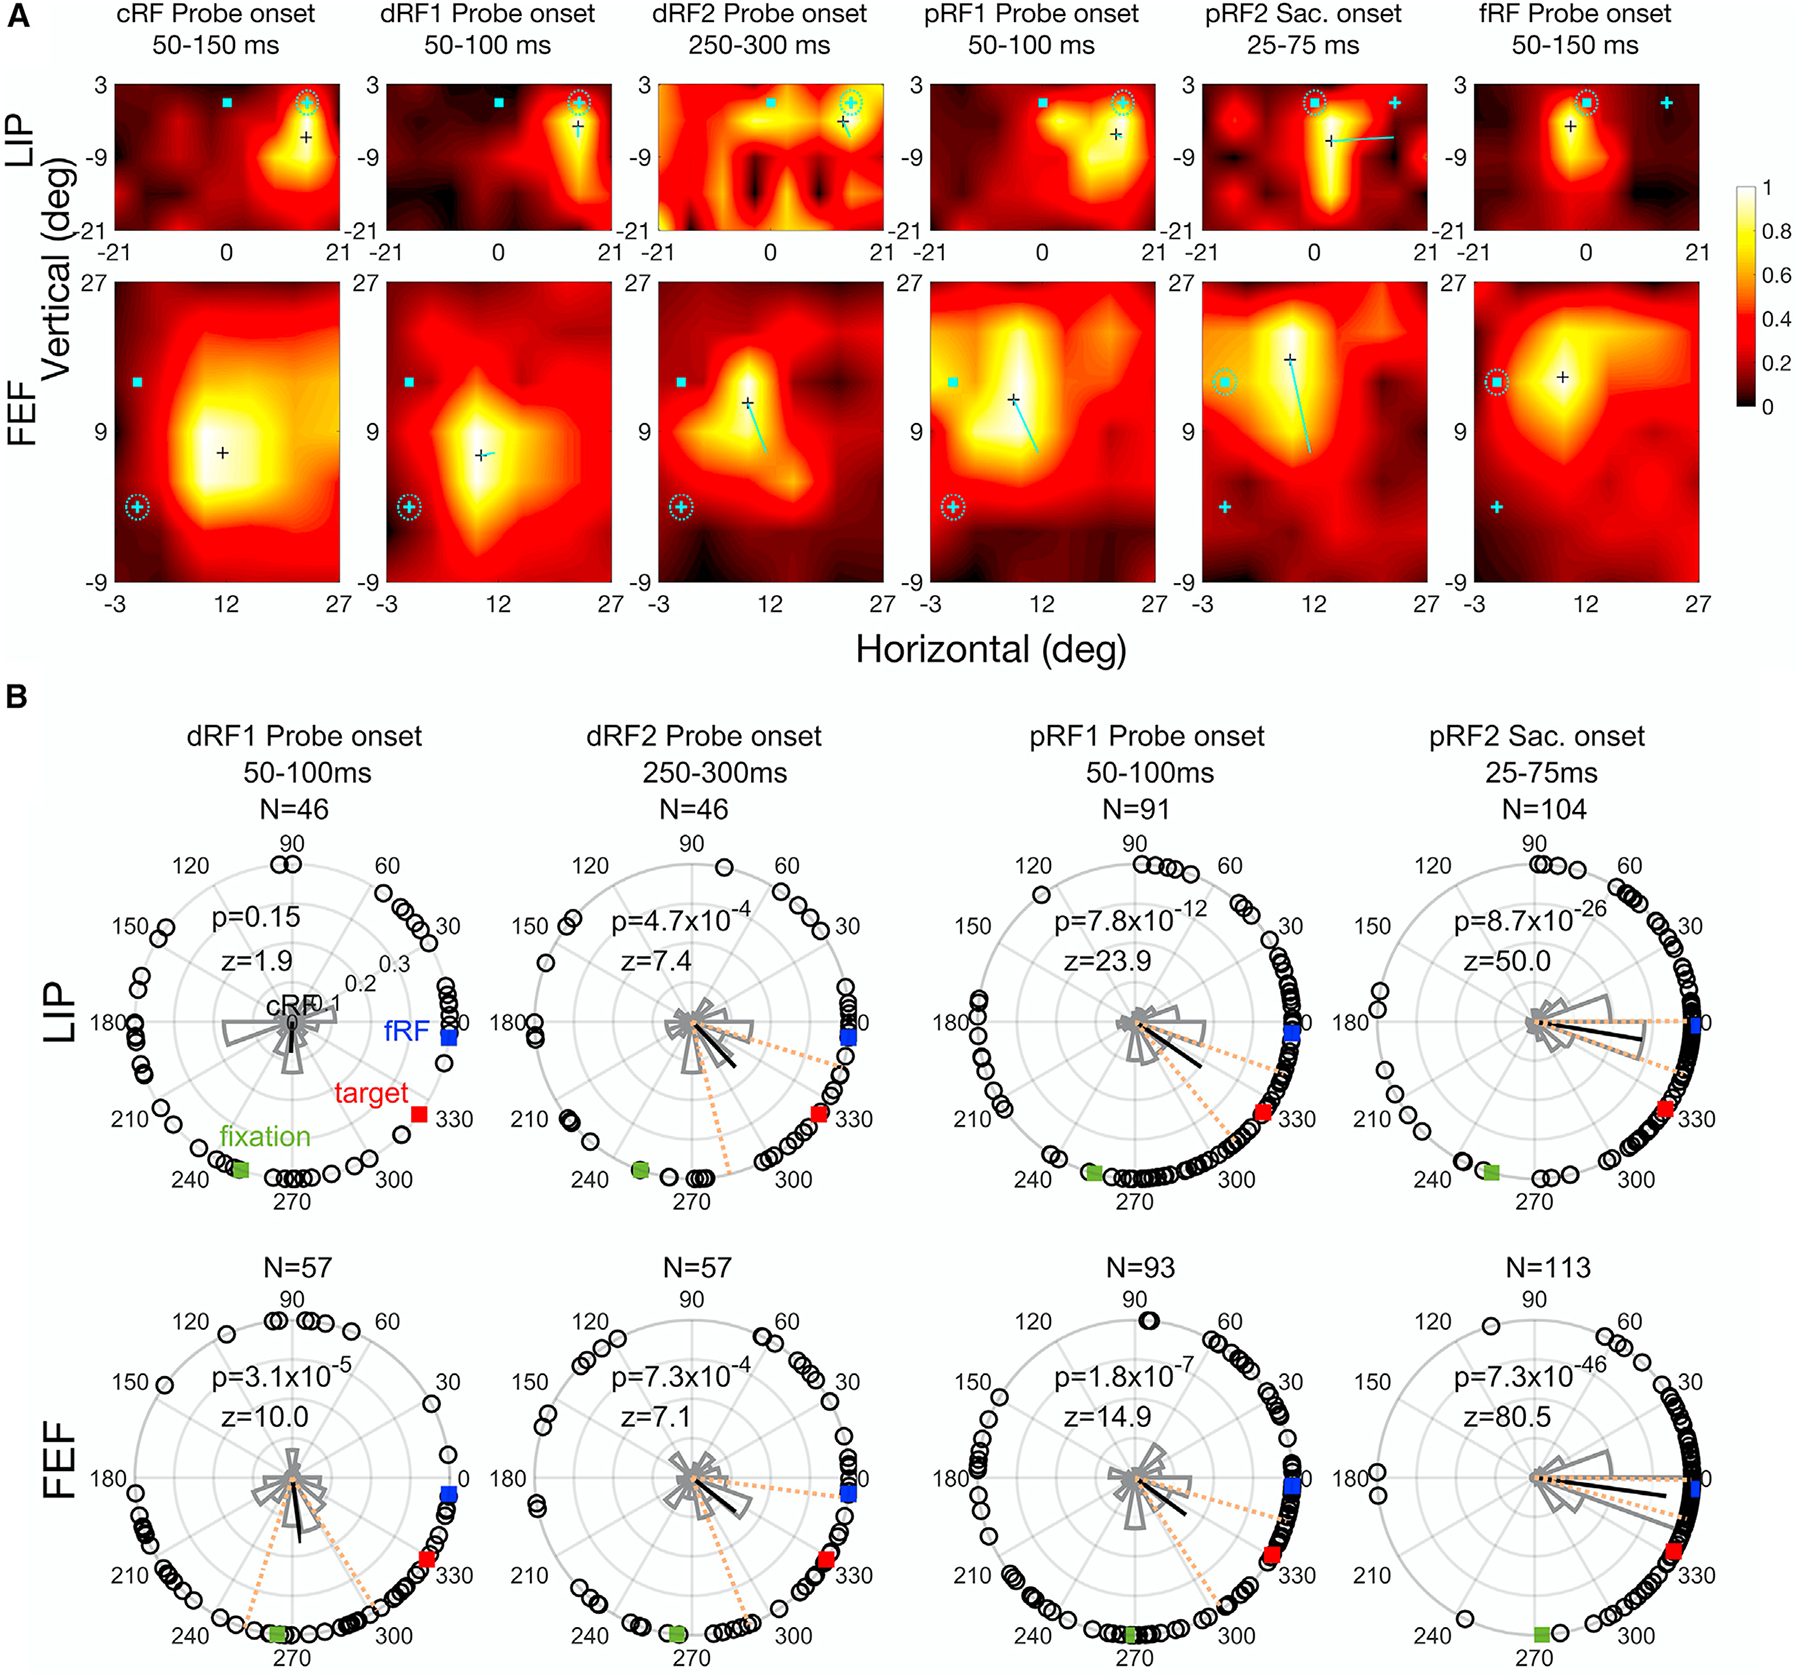
(A) RF heatmaps of an example LIP cell (top row) and FEF cell (bottom row) from different epochs (columns). In each map, the cyan cross, square, and dashed circle indicate the fixation point, saccade target, and eye position, respectively. The small black cross marks the RF center. The cyan lines in dRF and pRF maps indicate the center shift relative to the cRFs. The scale of normalized responses is shown on the right. The fifth column is based on the saccade onset alignment of the trials, whereas the other columns are based on the probe onset alignment.
(B) The dRF and pRF shift directions of the LIP (top row) and FEF (bottom row) populations from different epochs (columns). In each polar plot, we align the cells’ cRFs at the center and saccade directions along the positive horizontal. The cells’ mean fRF (forward), target, and initial-fixation directions are indicated by the blue, red, and green squares, respectively. Each open dot represents a cell’s RF shift direction, and the thick black line represents the circular mean whose significance is indicated by the p values from Rayleigh test. The dashed orange lines mark the 95% confidence interval of the mean direction. The circular histogram shows the distribution of the cells’ shift directions. The mean shift directions changed significantly across time in both the LIP (p = 1.0 × 10⁻⁵, F3,283 = 9.0) and FEF (p = 2.1 × 10⁻⁹, F3,316 = 15.5), with Watson-Williams multisample test. The fourth column is based on the saccade onset alignment of the trials, whereas the other columns are based on the probe onset alignment. The cell numbers (N) of the panels are different because the screening method was applied to each area, epoch, and alignment separately.