
Figure 7. Automatic generation of the required connectivity patterns in the circuit model by training neural networks.
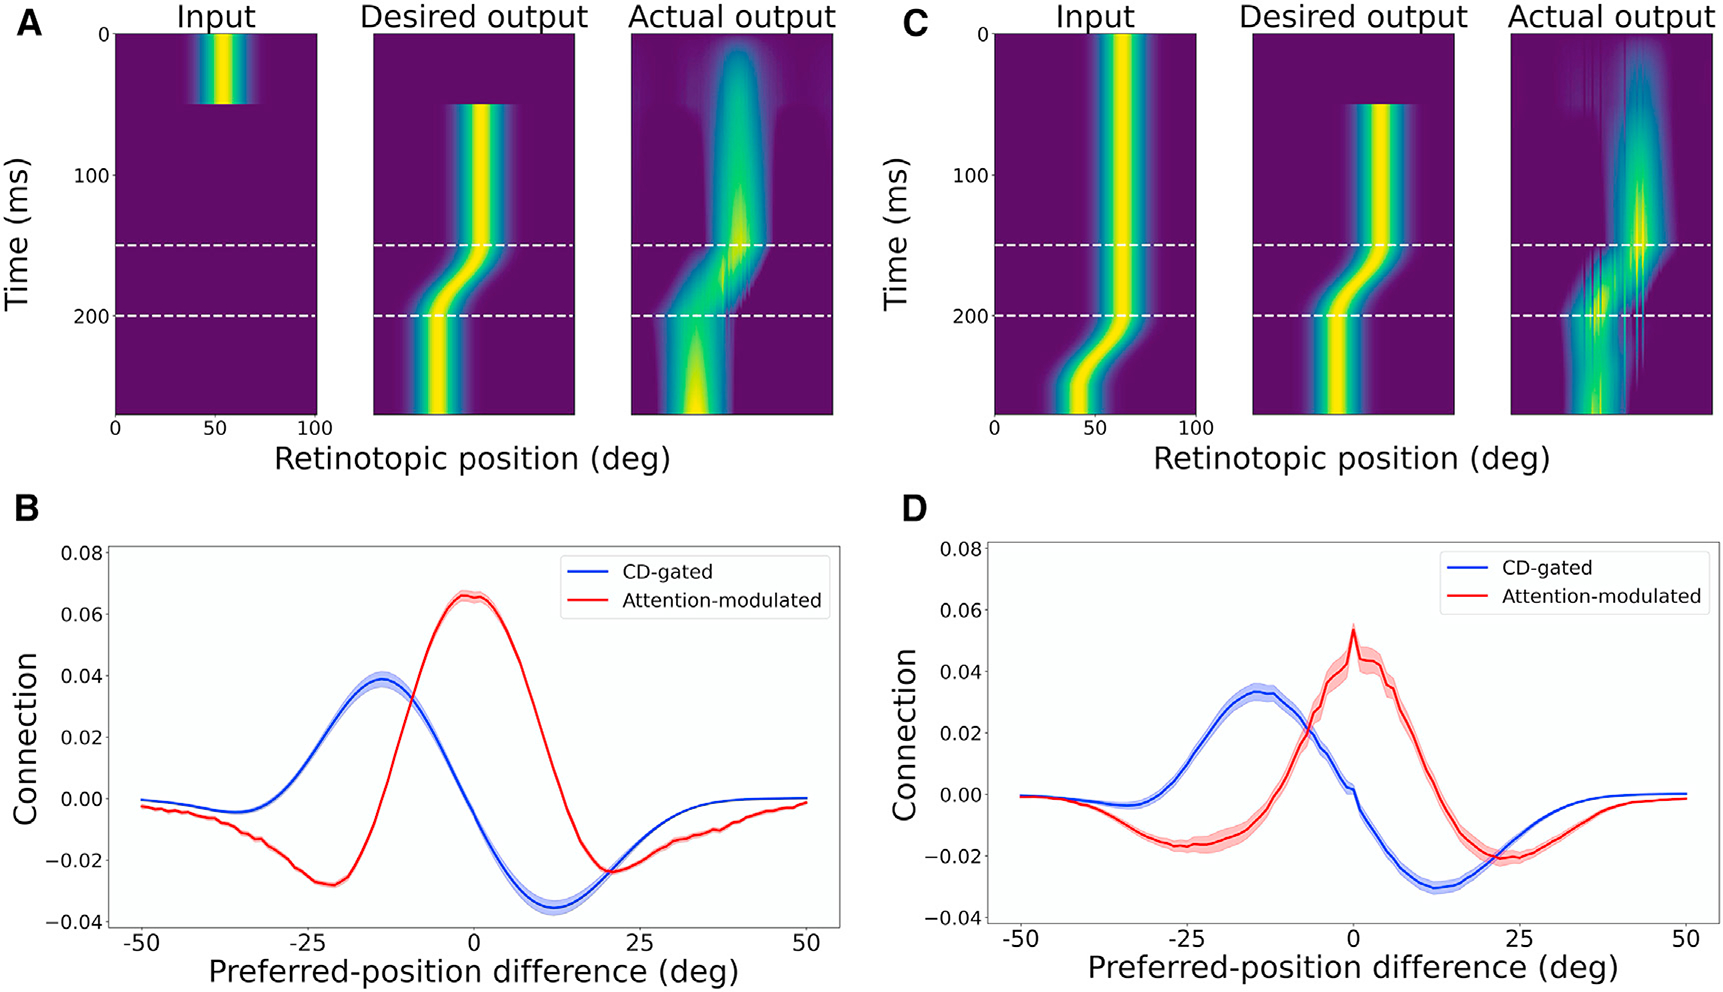
We trained the networks to predictively update retinal positions of stimuli across saccades. (A) and (B) are for the case of brief input stimuli, and (C) and (D) are for the case of persistent input stimuli. (A) and (C) show the test input (not included in the training), the desired output, and the actual output; all plots represent the population responses of units tuned to different retinal positions (x axis) as a function of time (y axis). (B) and (D) show the average connection weights as a function of the difference between two units’ preferred positions (RF centers). The red and blue curves are for the attention-modulated and CD-gated connections, respectively. Only the CD-gated connections for rightward saccades are shown. The shaded areas indicate 1 SEM (N = 50).