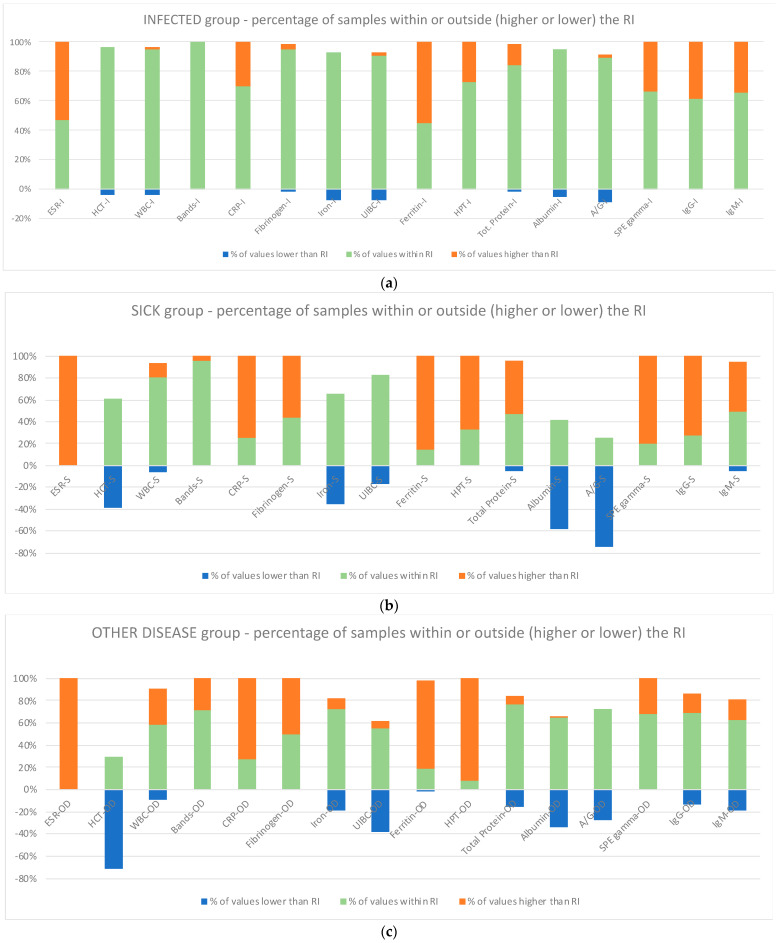
Figure 1.
The analytes investigated (ESR, HCT, WBC, Bands, CRP, Fibrinogen, Iron, UIBC, Ferritin, Haptoglobin, Total proteins, Albumin, A/G ratio, SPE gamma, IgG, and IgM) in the INFECTED (a), SICK (b), and OTHER DISEASE (c) groups evidenced with different colors for values lower and higher than RI or within RI and plotted. Legend: the letter after each blood parameter identifies the various group: I, Infected; S, Sick; OD, Other Disease; ESR, erythrocyte sedimentation rate; WBC, total leukocyte count; CRP, C-reactive protein; UIBC, unsaturated iron binding capacity; A/G, albumin–globulin ratio; SPE gamma, gamma globulin in serum protein electrophoresis; IgG, immunoglobulin G; IgM, immunoglobulin M.

