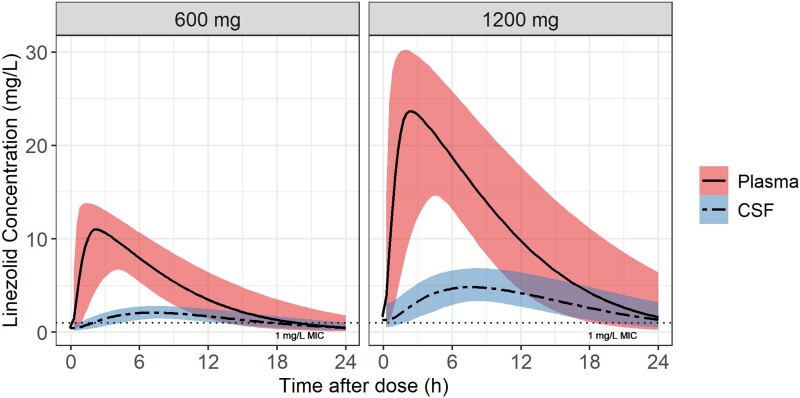
Figure 3.
Simulated typical concentration-time profiles for plasma and cerebrospinal fluid (CSF) for the oral daily dose of linezolid: 1200 and 600 mg. The solid and dashed lines represent the median for the plasma and CSF, respectively, and the shaded areas represent the 90% CIs. The horizontal dotted line indicates the wild type minimum inhibitory concentration (MIC) value of linezolid for Mycobacterium tuberculosis.

