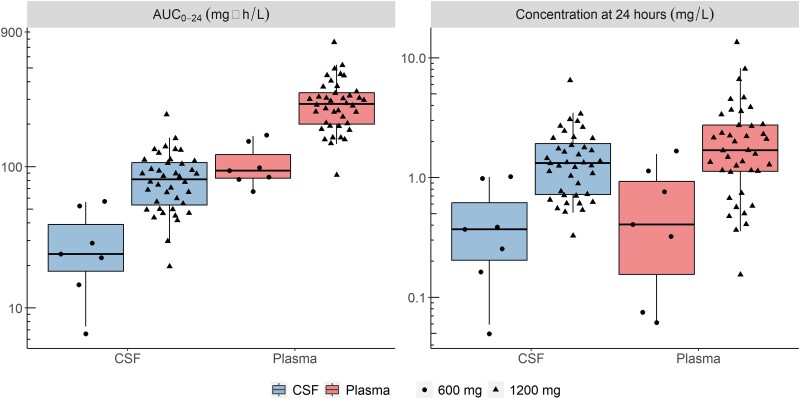
Figure 4.
Secondary model-derived exposure parameters: AUC0-24h and concentration at 24 hours postdose (C24h) stratified by dose. Horizontal lines indicates medians. Boxes represent IQRs while whiskers are the 2.5th and 97.5th percentiles. Dots represent individual values: n = 7, 600 mg; n = 40, 1200 mg (n = 30, day 3; n = 10, day 28). AUC, area under the curve.

