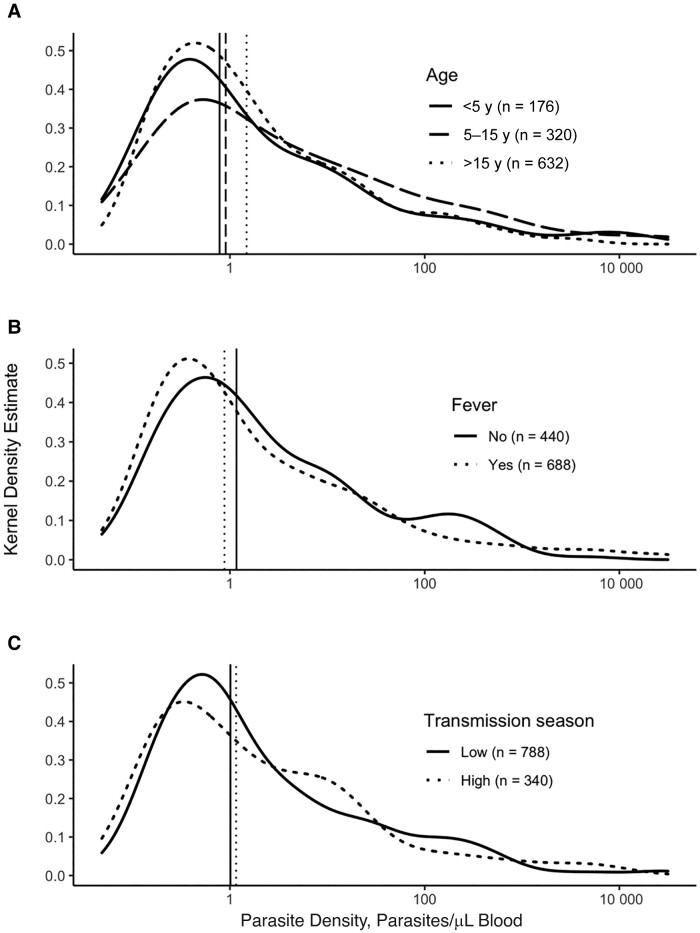
Figure 1.
Distribution of parasite densities in rapid diagnostic test–negative subpatent infections. Kernel density curves show the distribution of parasite densities across age groups (A), febrile status (B), and transmission seasons (C). Vertical lines represent the median parasite density in each group. Febrile episodes were defined as episodes during which the participant's measured temperature exceeded 37.4°C, the participant reported a recent history of fever, or both. The transmission season was categorized as low or high transmission according to the number of female Anopheles mosquitos collected across the study site in the 14 days before evaluation (low transmission, ≤75 mosquitos; high transmission, >75 mosquitos).

