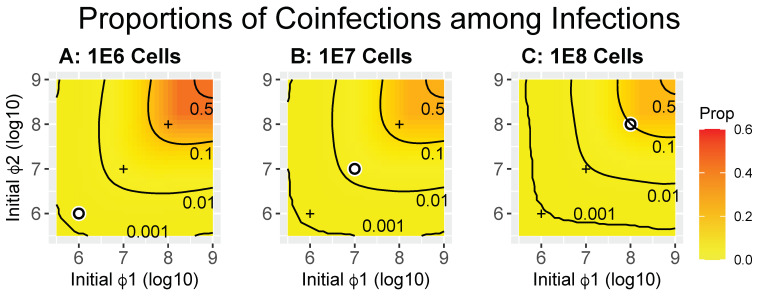
Figure 3.
Heatmaps of coinfected cells as a proportion of all infected cells (calculated as X12/(X12 + X1T + X2T + X1P + X2P) from Equation (1) at time = 50). Contours are labeled by the value of the proportion. Trials are the same as in Figure 2. In contrast to Figure 2, there is only a small difference observed for this measure. Panels (A–C) differ only in the number of bacteria introduced, as given by the titles. The white dot in each panel indicates the point at which both phage densities equal bacterial densities (MOI = 1); for convenience of comparison, the ‘+’ marks in each panel are merely reference points to the white dots in the other two panels.

