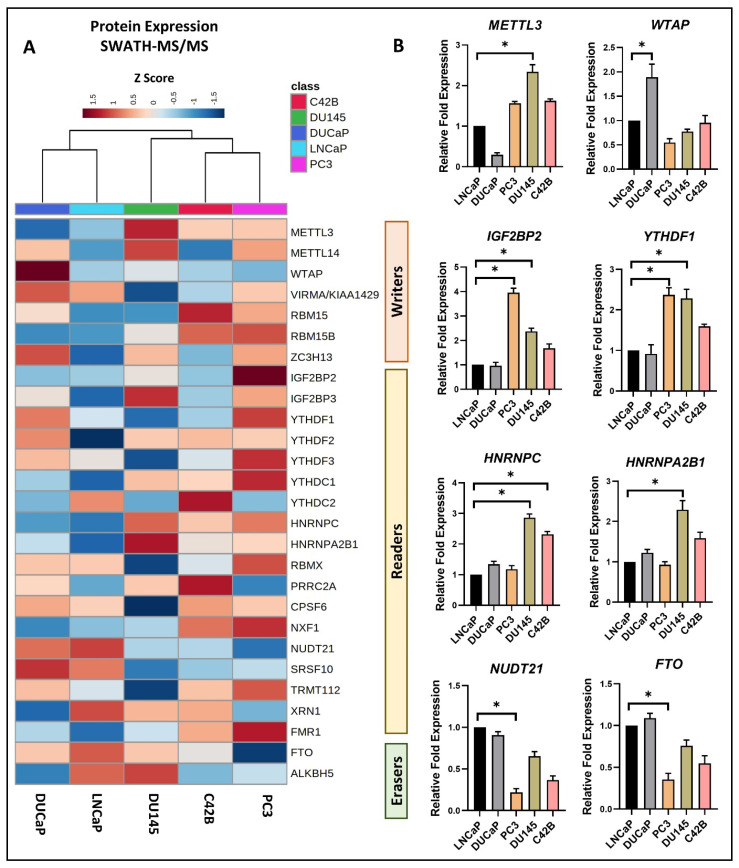
Figure 1.
Differential expression of m6A methylation regulators in PCa cell lines examined using (A) SWATH-MS analysis and (B) qPCR analysis for proteomic and transcriptomic perspectives, respectively. (A) Normalized peak areas/intensities (Z Score) were utilized to generate a heatmap visualization of protein expression. Hierarchical clustering using the Ward algorithm, based on Euclidean distance, determined the column orders. (B) A total of eight m6A regulators exhibited significant differential expression in PCa cell lines. The relative fold expression of mRNA in each cell line was normalized to its expression in the LNCaP cell line using the ΔΔCT method (n = 3 technical replicates, mean ± SD, paired t-test * p < 0.05).

