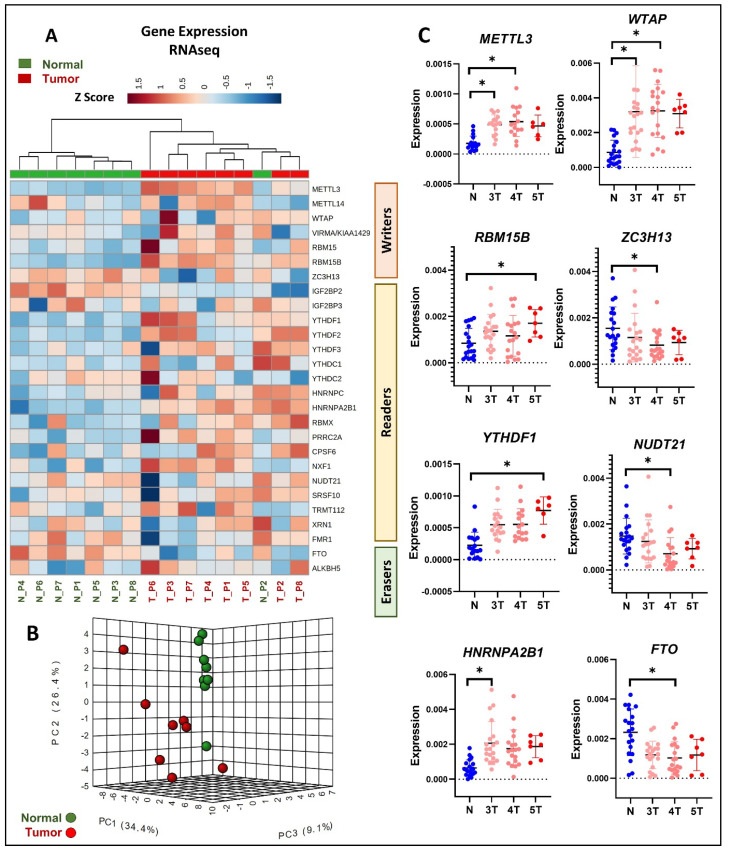
Figure 3.
The expression of m6A regulator genes in primary PCa clinical tissues was assessed through both RNAseq and qRT-PCR analyses. (A) For RNAseq analysis, normalized m6A gene expression data were obtained from eight primary PCa clinical tissue samples and their adjacent normal tissues. Hierarchical clustering was performed using the Ward algorithm on the normalized RNAseq data, and column orders were arranged based on Euclidean distance. (B) Principal component analysis was conducted on the first three principal components identified from the normalized RNAseq data. (C) For qRT-PCR analysis, a total of 35 primary PCa clinical tissues with varying tumor grades, along with their adjacent normal tissue samples, were utilized. Tumor samples are denoted by red dots, showcasing an increasing intensity from low-grade to high-grade tumors, while blue dots represent adjacent normal tissues. Gene expression levels were determined using the ΔCT method (n = 3 technical replicates, mean ± SD, paired t-test * p < 0.05).

