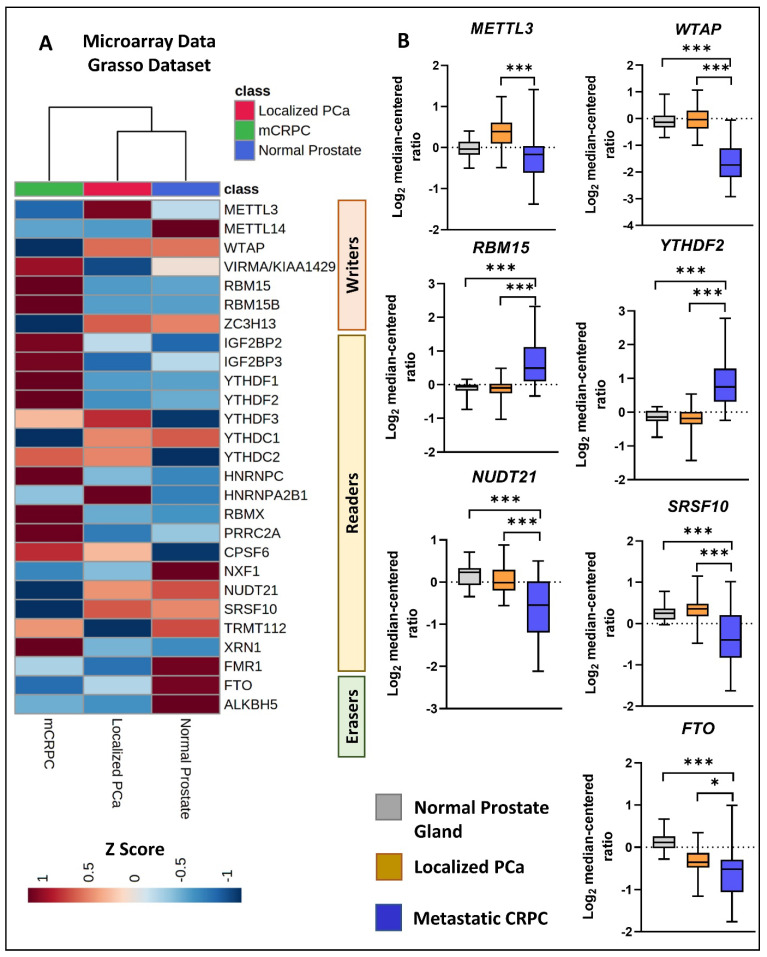
Figure 4.
Differential expression of m6A methylation regulators in localized PCa and CRPC clinical tissues. (A) We conducted a comparison of the transcriptomic expression of m6A methylation regulators among non-PCa (n = 28), localized PCa (n = 59), and mCRPC (n = 35) clinical tissue specimens using tissue microarray data obtained from the previously published study [27]. The selected probes for the expression analysis are detailed in Table S5. (B) The figure illustrates the expression of the top significantly differentially expressed microarray probes for each gene, as listed in Table S5. Gene expression levels were measured as log2 median-centered ratios (mean ± SD, paired t-test, * p < 0.05, *** p < 0.0001).

