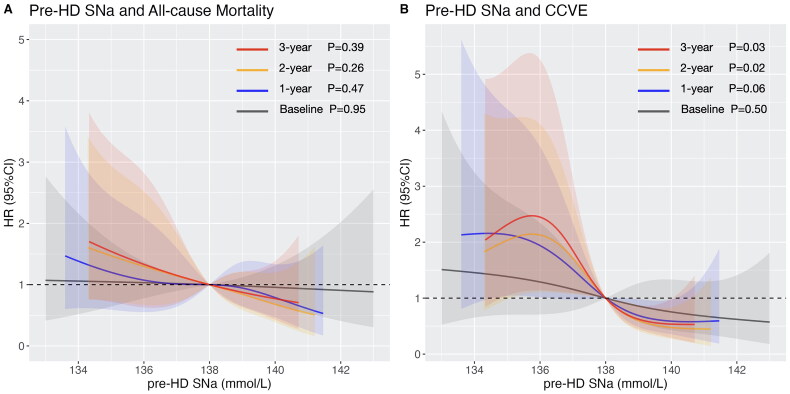
Figure 1.
Multivariable-adjusted restricted cubic spline plots of pre-HD SNa for (A) all-cause mortality, with adjustment of age, BMI, CCVD history, SCr, and Alb; and for (B) cardio-cerebrovascular event, with adjustment of age, BMI, CCVD history, CRP and Ferr. Grey, blue, orange and red color represent the RCS curves of baseline pre-HD SNa, 1-year pre-HD SNa, 2-year pre-HD SNa and 3-year pre-HD SNa, respectively. Shadow represents the 95% confident interval.

