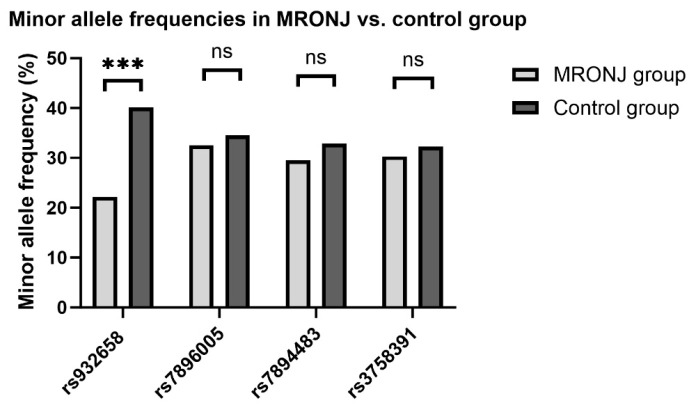
Figure 3.
Bar chart showing the minor allele frequencies of the SNPs tested. The lighter color represents the Medication-Related Osteonecrosis of the Jaw (MRONJ) patients studied; the darker color represents the average population’s value based on the NCBI Allele Frequency Aggregator (ALFA) database. (https://www.ncbi.nlm.nih.gov/bioproject/PRJNA507278, accessed on 1 January 2024) A significant difference between MRONJ and the control group was detected in rs932658. *** p = 4.5 × 10⁻⁵. ns = not significant.

