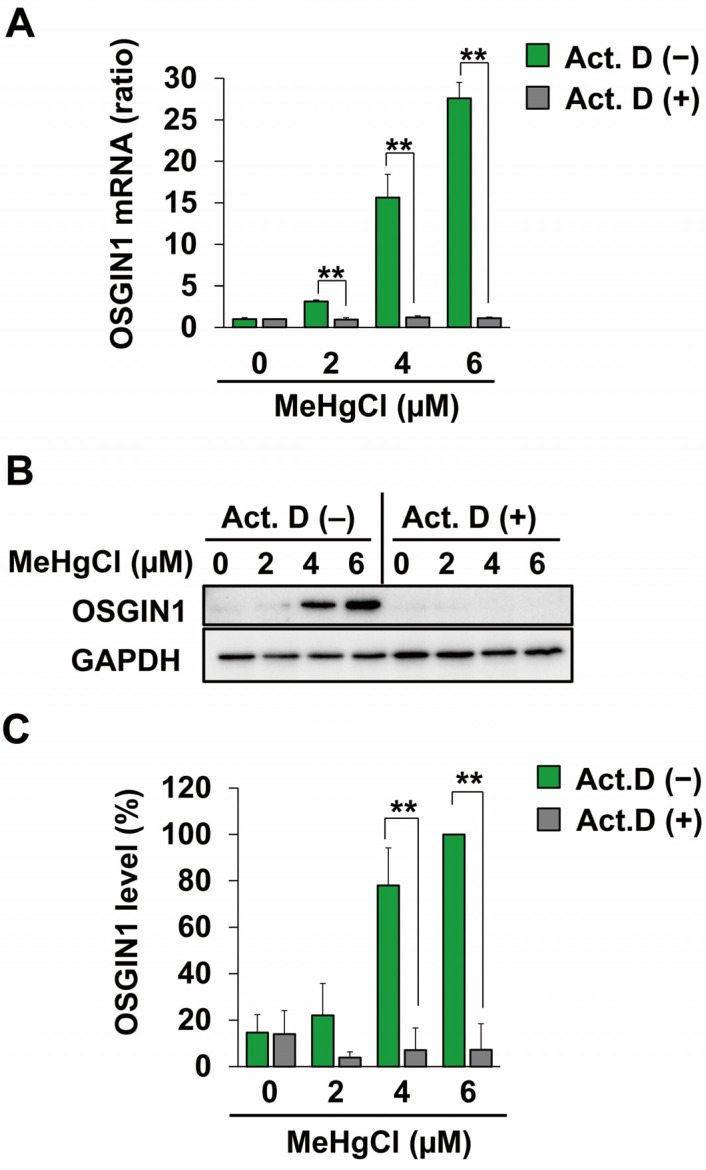
Figure 3.
Effects of a transcription inhibitor on induction of OSGIN1 expression by methylmercury. C17.2 cells (4 × 10⁴ cells/well) were seeded onto 24-well plates for 23 h. C17.2 cells were pretreated with 1 µM of actinomycin D (Act. D) for 1 h and exposed to the indicated concentration of methylmercury chloride (MeHgCl) for 8 h. (A) mRNA levels of OSGIN1 and GAPDH were measured, and relative values normalized to GAPDH are shown. OSGIN1 protein levels were examined by Western blotting (B). Quantification of the band intensity of OSGIN1 [the band intensity of control cells exposed to MeHgCl (6 μM) was considered as 100%, normalized to each GAPDH level] shown in (C). The data are represented as mean ± SD. ** p < 0.01.

