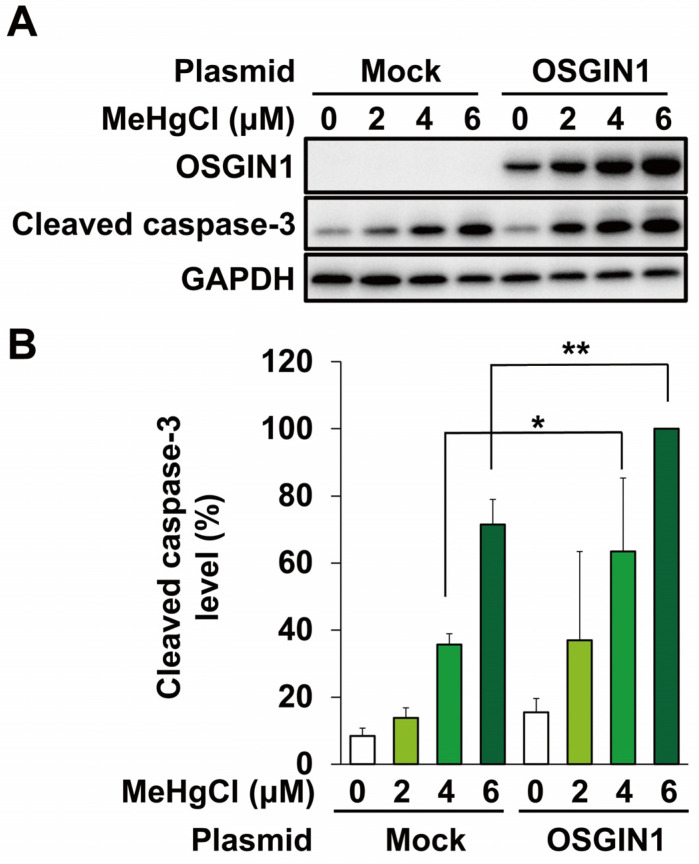
Figure 6.
Effects of overexpression of OSGIN1 on methylmercury-induced apoptosis. C17.2 cells (2 × 10⁴ cells/well) were seeded onto 24-well plates for 24 h. C17.2 cells were transfected with empty vector (Mock) or OSGIN1-expressing plasmid for 24 h. Cells were then exposed to the indicated concentration of methylmercury chloride (MeHgCl) for 24 h. (A) OSGIN1 and cleaved caspase-3 protein levels were examined by Western blotting. Quantification of the band intensity of cleaved caspase-3 [the band intensity of control cells exposed to MeHgCl (6 μM) was considered as 100%, normalized to each GAPDH level] shown in (B). The data are represented as mean ± SD. ** p < 0.01, * p < 0.05.

