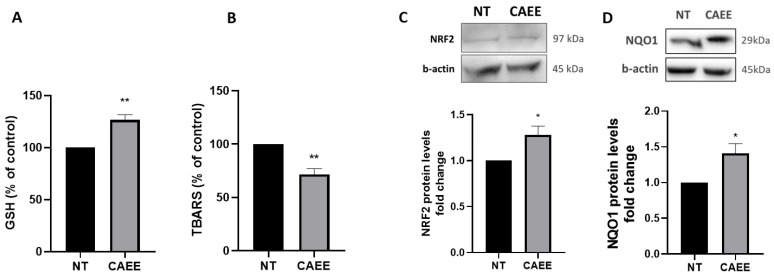
Figure 3.
CAEE effect on the antioxidant potential of WJ-MSCs. (A) Bar graph demonstrating the change of glutathione (GSH) levels expressed as % of control levels measured in WJ-MSCs treated with CAEE for 24 h or not (NT). NT value was arbitrarily set to 100. (B) Bar graph demonstrating the change in TBARS levels expressed as % of control levels measured in WJ-MSCs treated with CAEE for 24 h or not (NT). (C,D) Representative immunoblots and densitometric analysis of NRF2 (C) and NQO1 (D) protein levels (fold change) in WJ-MSCs treated with CAEE for 24 h compared to untreated WJ-MSCs (NT). NT value was arbitrarily set to 1. The values shown are the means ± S.E. as the experiments were repeated 3 times using cells from three different donors (n = 3). Asterisk marks statistical significance (p < 0.05) in all panels (* = p < 0.05, ** = p < 0.01).

