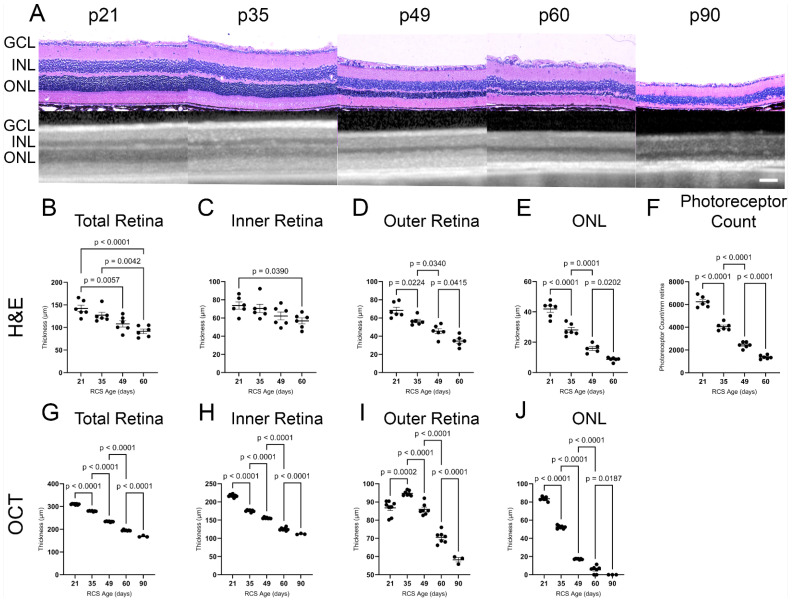
Figure 1.
Structural analysis of RCS retina over time using histology and ocular coherence tomography (OCT). Representative H&E histology and OCT images for each age timepoint p21–p90 (A). Thickness of retinal layers (total, inner, outer, and outer nuclear layer (ONL)) significantly decline with RCS age as measured by H&E (B–E) and OCT (G–J) with the most drastic changes in the ONL where the photoreceptors are located. Photoreceptor nuclei counts show significant degeneration in histological analysis until p60 (F). Data represented as mean ± SEM, two-way ANOVA with Tukey’s correction. Histology n = 6 for each group. OCT imaging: n = 8, 7, 7, 7, 3 for p21, p35, p49, p60, and p90, respectively. Each dot in graphs (B–J) represents measurements from an individual animal. Scale bar = 100 µm.

