Figure 2.
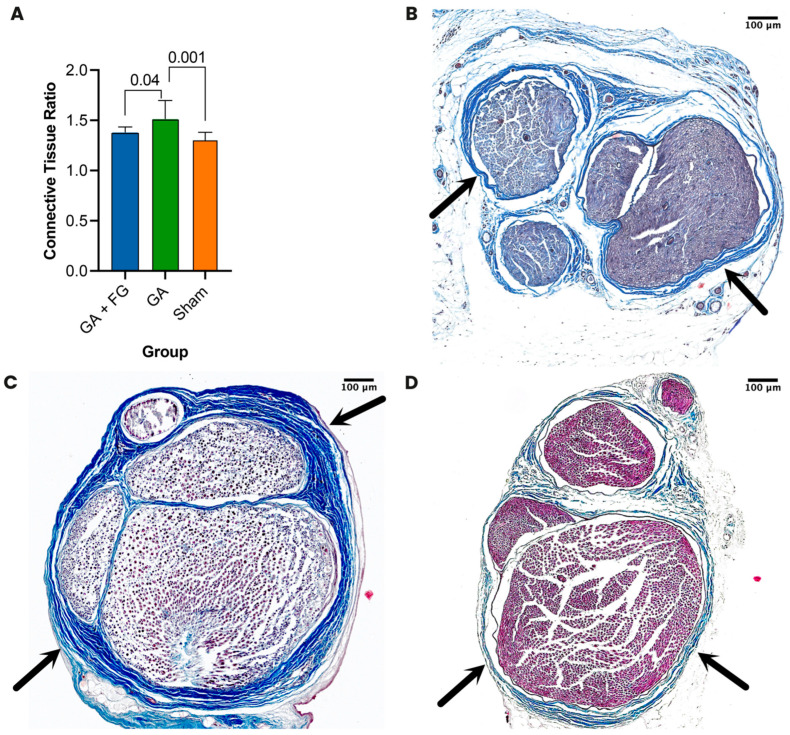
Histologic assessment of perineural scar tissue formation. (A) Connective tissue ratio. The GA group had the highest ratio, which was significantly different from those of the Sham and the GA + FG groups. (B–D) Representative cross sections of the sciatic nerve. (B) The GA + FG group showed limited scar tissue formation (black arrows) adherent to the nerve after 12 weeks. (C) The GA group showed the most extensive epi- and perineural scar tissue formation (black arrows). (D) The Sham group showed the lowest scar tissue formation in terms of both epi- and perineurium (black arrows).

