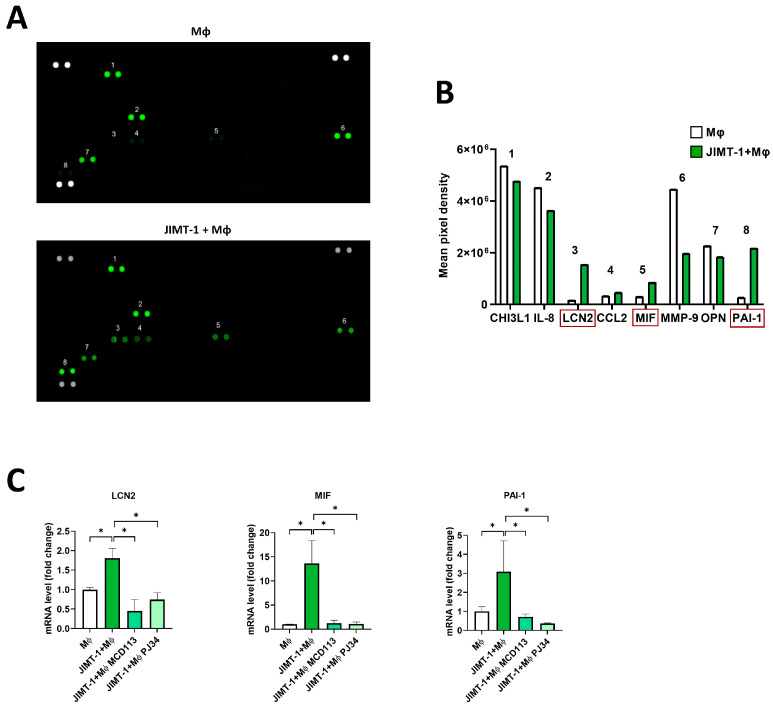
Figure 7.
Proteome profiling suggesting the involvement of LCN2, MIF, and PAI-1 in TAM polarization. Spheroids were generated either from THP-1-derived MΦs or JIMT-1-THP-1-MΦ co-cultures. Cells were kept in cultures for 4 days (1 day in the presence of 20 ng/mL IFN-γ), and supernatant was collected. Cell supernatants (500 μL) were added to each membrane array (A), and analytes were detected by proteome profiling as described in Section 4 (B). Using the same conditions, RNA was also extracted from spheroids, and mRNA levels of the same set of cytokines were quantified by RT-qPCR. Treatments with the PARPi PJ34 (25 μM) and PARP14i MCD113 (55 μM) resulted in a significant decrease in the expression of these cytokines (C). The numbers in (A,B) indicate the different cytokines detected. Red rectangles in (B) depict the three cytokines selected for quantitation by RT-qPCR, as shown in (C). Graphs show mean of at least 3 independent experiments (±SEM). Statistical evaluation was performed with one-way ANOVA and Tukey’s post-hoc test (* p < 0.05).

