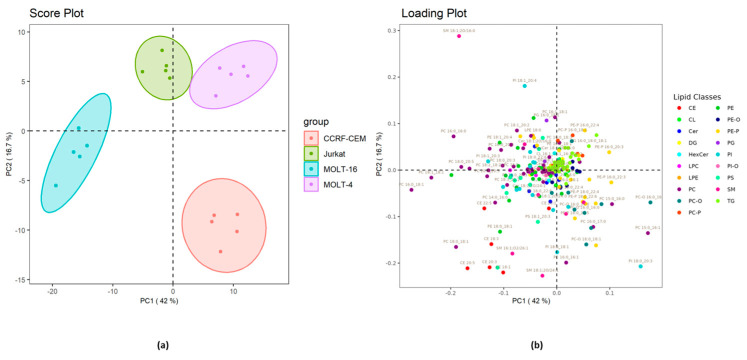
Figure 5.
(a) PCA score plot of the lipid molecular species from the four cell lines. The ellipses enclose the scores inside a region with 95% confidence. (b) Loading plot of the lipid molecular species which contribute to the separation among the cell lines. Before the analysis, data matrix was normalized and pareto scaling was applied.

