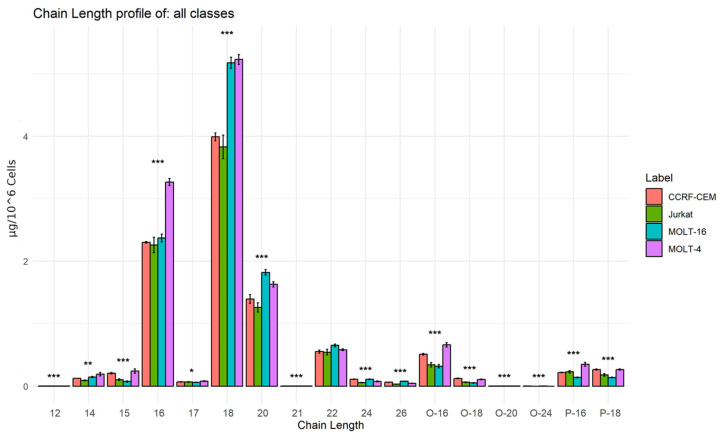
Figure 7.
Bar graph: The figure shows the average concentrations (ug/106 of cells) of the chains with different lengths. Experimental error bar (n = 5) and ANOVA significance asterisks are represented (*** indicates p-value < 0.001, ** indicates p-value < 0.01, and * indicates p-value < 0.05). This graph was made with R program (R version 4.2.3 (2023-03-15 ucrt)).

