Figure 2.
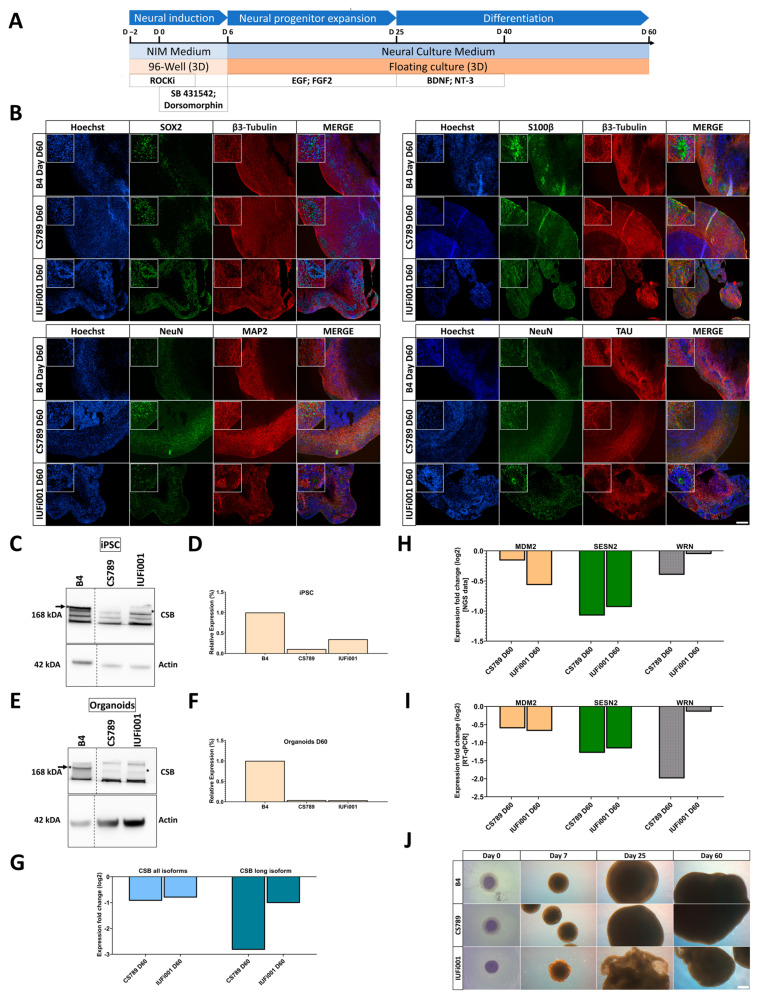
Generation and characterization of CS organoids. (A) Schematic outline of the protocol to generate iPSC-derived cerebral organoids. (B) Representative immunocytochemistry images of the distribution of cells expressing SOX2, β3-Tubulin, S100, NeuN, MAP2 and TAU. 100× magnification, scale bar 200 µm. (C) Western blot analysis for full-length CSB and beta-actin at the iPSC stage. (D) Quantification of CSB Western blot analysis at the iPSC stage in CTRL (B4), CS789 and IUFi001. CSB expression of CS789 and IUFi001 is compared to CSB expression in CTRL (B4) (E). Western blot analysis for full-length CSB and beta-actin at day 60 of organoid differentiation. (F) Quantification of CSB Western blot analysis at iPSC stage in CTRL (B), CS789 and IUFi001. CSB expression of CS789 and IUFi001 is compared to CSB expression in CTRL (B4). (G) qRT-PCR analysis of full-length CSB mRNA expression and all isoform CSB mRNA expression in CS789 and IUFi001 organoids relative to control organoids. (H) Relative mRNA expression analysis of DNA damage-related genes MDM2, SESN2 and WRN in CS789 and IUFi001 organoids compared to CTRL (B4). (I) qRT-PCR analysis of MDM2, SESN2 and WRN mRNA expression in CS789 and IUFi001 organoids relative to CTRL (B4). (J) Representative brightfield images of control and CS organoids at day 0, 7, 25 and 53 of differentiation. Scale bar 200 µm. (C,E) Arrows indicate bands of interest. Asterisk (*) indicates height of bands of interest on the right side. Dotted lines indicate excision point of one sample. Full-length blots are presented in Supplementary Figure S3.

