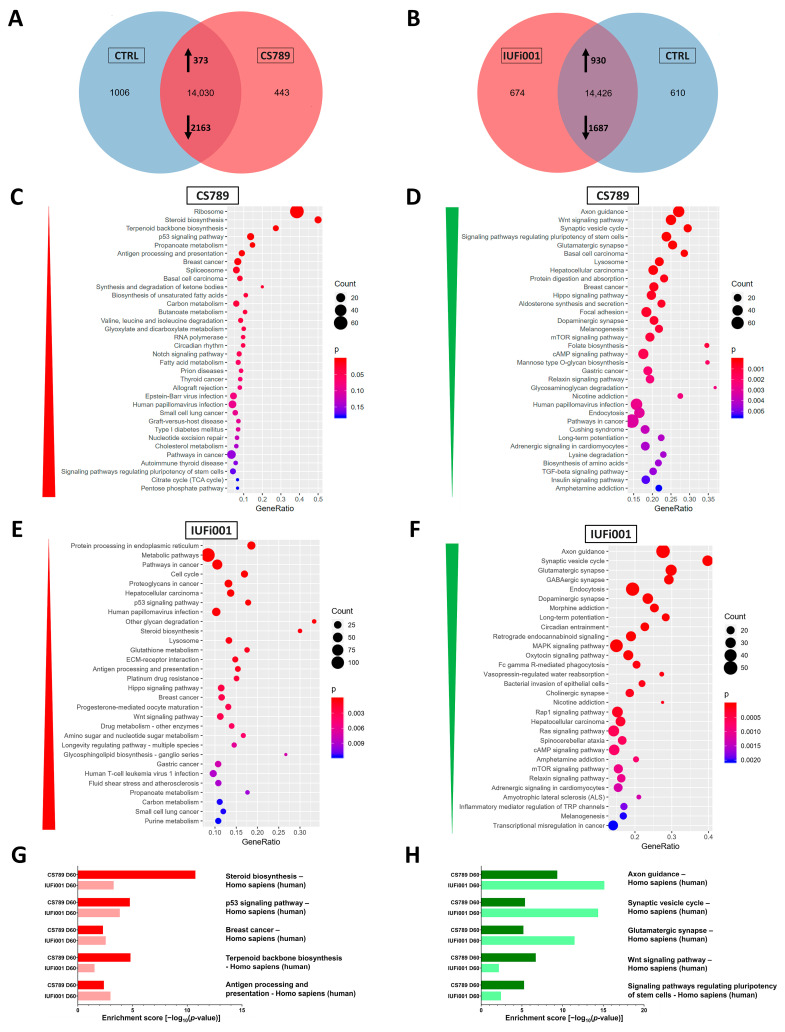
Figure 4.
Global transcriptome and associated pathway analysis of control and CS organoids at day 60. (A) Venn diagram showing genes expressed only in CS789 organoids (443), in CTRL (B4) organoids (1006) and common to both (14,030) (detection p value < 0.05). (B) Venn diagram showing genes expressed only in IUFi001 organoids (674), in CTRL (B4) organoids (610) and common to both (14,426) (detection p value < 0.05). (C,D) Dot plots showing the top 30 differentially regulated KEGG pathways (C) in the 373 significantly upregulated DEGs in day 60 CS789 organoids in comparison to CTRL (B4) (D) and in the 2163 significantly downregulated DEGs in day 60 CS789 organoids in comparison to CTRL (B4). (E,F) Dot plots showing the top 30 differentially regulated KEGG pathways (E) in the 930 significantly upregulated DEGs in day 60 IUFi001 organoids in comparison to CTRL (B4) (F) and in the 1687 significantly downregulated DEGs in day 60 IUFi001 organoids in comparison to CTRL (B4). (G) Bar chart of the differentially upregulated KEGG pathways (top five ranked) common between day 60 CS789 and IUFi001 organoids in comparison to CTRL (B4) organoids. (H) Bar chart of the differentially downregulated KEGG pathways (top five ranked) common between day 60 CS789 and IUFi001 organoids in comparison to CTRL (B4) organoids.

