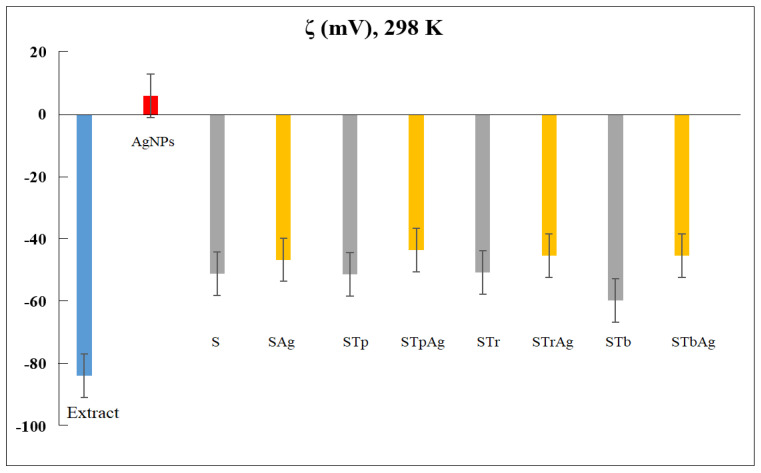
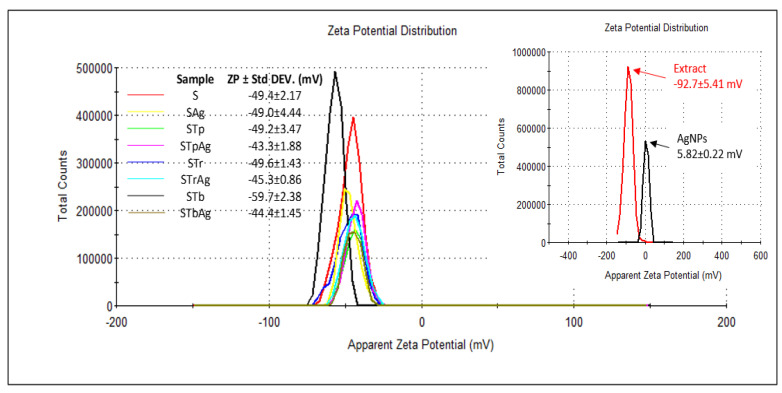
Figure 8.
Zeta potential values and distribution curves of S, STp, STr and STb nanoemulsions in the absence and presence of AgNPs at 298 K (inset panel is for extract and AgNPs). For the extract, AgNPs and each type of support/support–AgNPs, zeta potential values are the average result for five measurements and the standard deviation.


