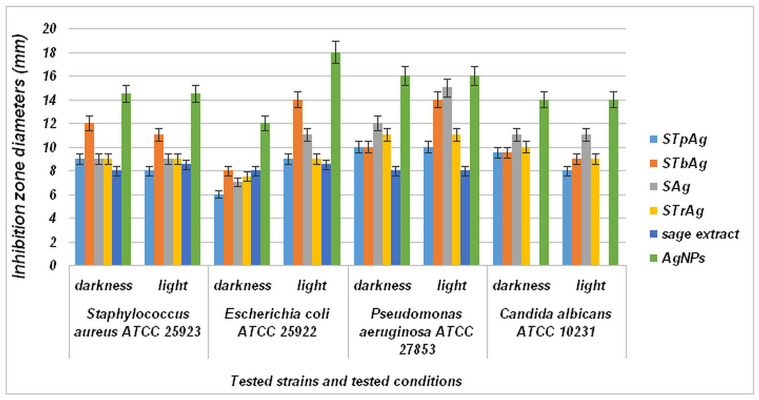
Figure 11.
Graphic representations of the comparative results regarding the inhibition zone diameters, mm. The results are expressed as ±SD (standard deviation) and analyzed using a one-way analysis of variance (one-way ANOVA). The differences between groups were considered statistically significant when the p-value was <0.05.

