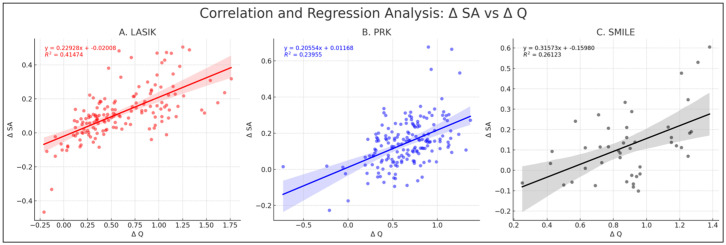
Figure 4.
Correlation and regression analysis of Δ SA vs. Δ Q. This figure comprises three plots representing the correlation and regression analysis for the change in Δ SA against the change in Q-value (Δ Q) across LASIK (A), PRK (B), and SMILE (C). Each scatter plot with a linear regression line shows the equation of the regression line and the corresponding R2 value. PRK = photorefractive keratectomy, LASIK = laser-assisted in situ keratomileusis, SMILE = small incision lenticule extraction, HOAs = higher-order aberrations, SA = spherical aberration.

