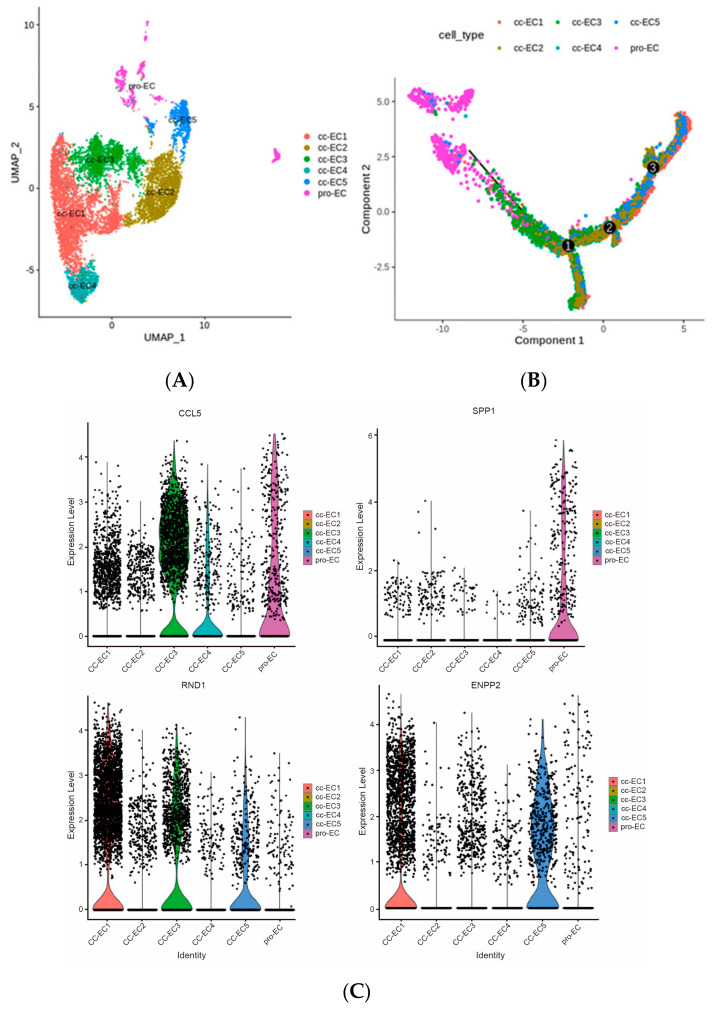
Figure 4.
(A) UMAP clustering results of the subclusters of endothelial cells. (B) Evolutionary trajectory of the subclusters, reconstructing the cell differentiation order; numbers 1 to 3 denote the turning points of trajectory development. (C) The expression distribution of significantly expressed genes in different EC subtypes.

