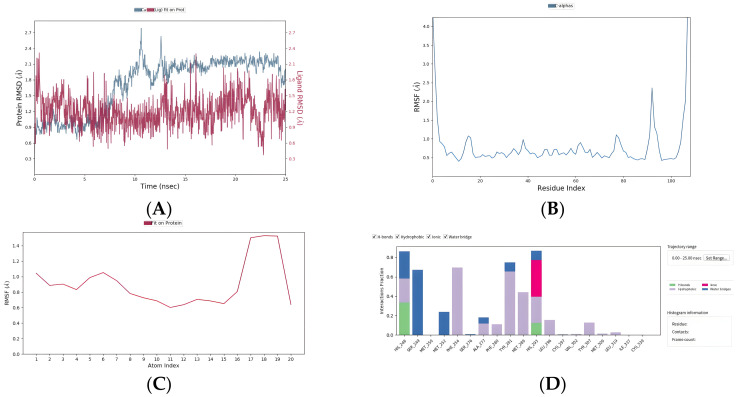
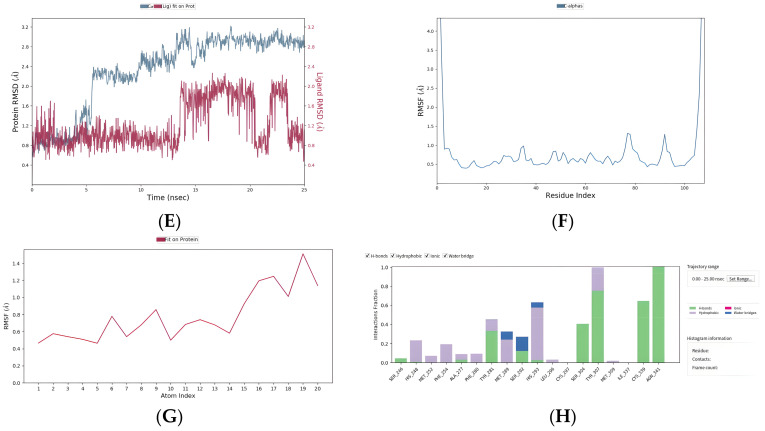
Figure 9.
Molecular dynamics simulation results of FDA drugs flufenamic acid and fludarabine. (A–D) Flufenamic acid: root mean square deviation curve (RSMD), root mean square wave curve (RMSF), small molecule root mean square wave curve (RMSF), and statistics of interaction proportion of different residues. (E–H): The same metrics as above, but for fludarabine.


