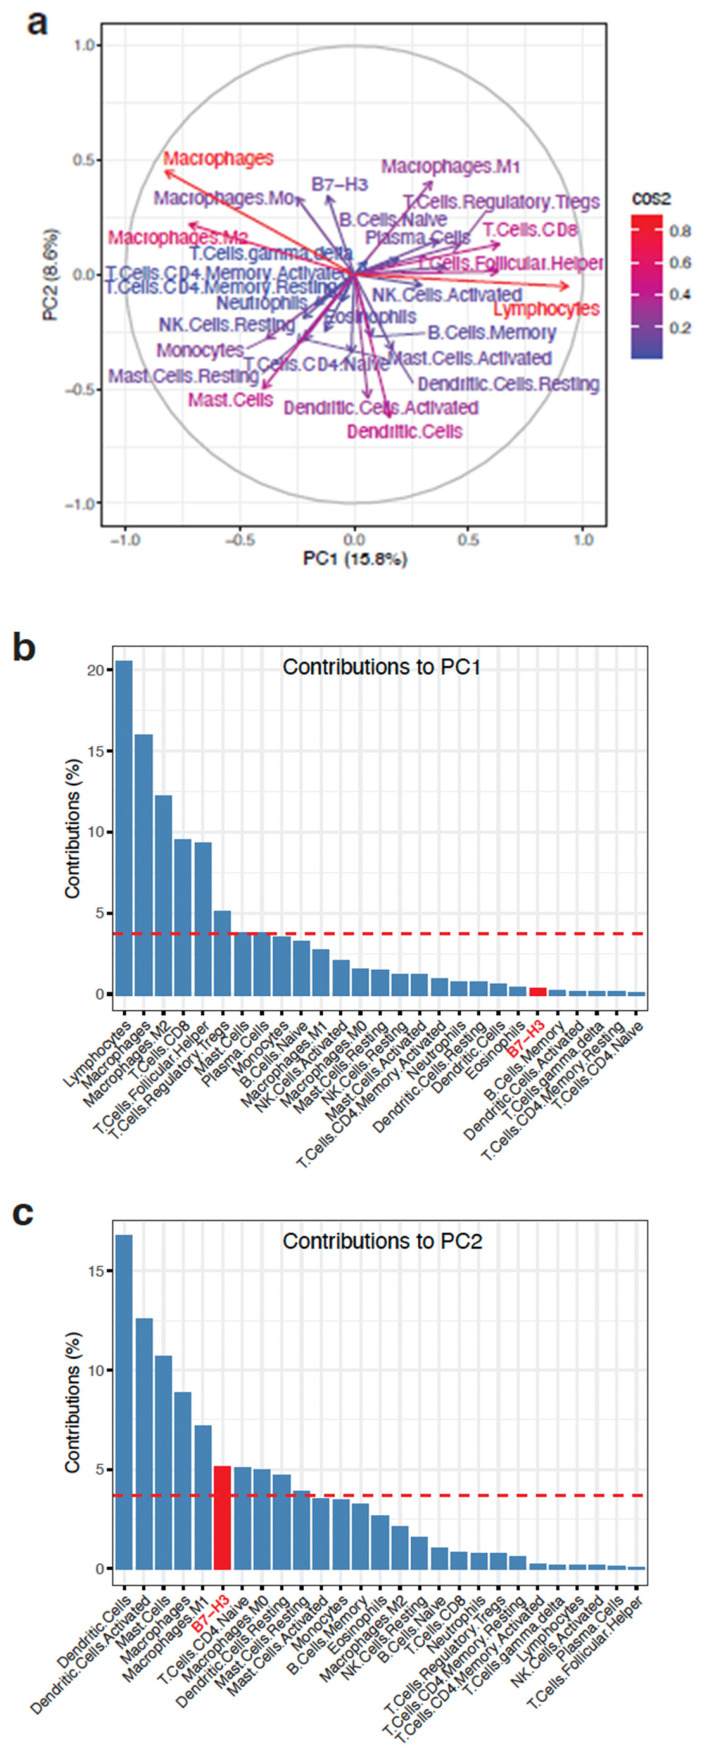
Figure 1.
Principal component analysis of B7-H3 expression and infiltrated immune cell types. (a) PCA showing the contributions of the respective infiltrated immune cell types or states and B7-H3 to the first two principal components (PC1 and PC2). Colours of the arrows for each variable are proportional to square cosine (cos2), showing the degree of representation of the variables to PC1 and PC2. (b,c) Decomposition of PC1 (b) and PC2 (c) showing the contributions of each of the variables. The dotted horizontal line indicates the contribution level if all variables had uniformly contributed. B7-H3 is highlighted in red.

