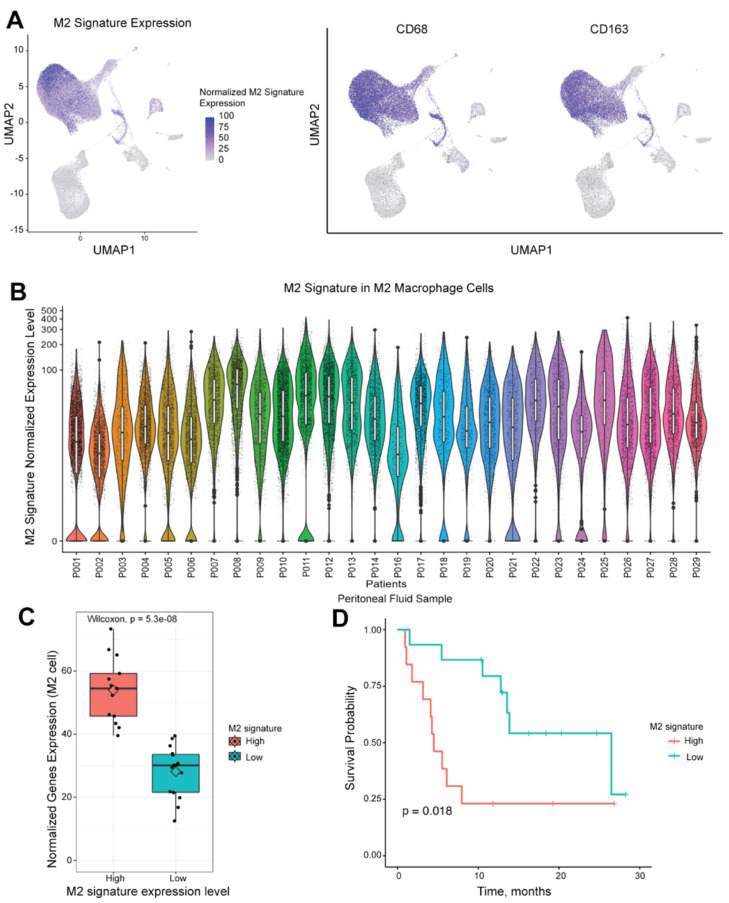
Figure 3.
M2-defining signature is expressed in the M2 macrophage cell cluster on single-cell analysis of peritoneal fluid samples and is associated with survival in peritoneal fluid samples. (A) UMAP plot displays the cells with higher M2-defining signature expression as purple dot, which is primarily seen in the M2 macrophage cells (CD68+CD163+). (B) The expression profile of the M2-defining macrophage signature is plotted on the y-axis (log scale) using the single-cell RNA seq expression per a single sample. Each dot represents one single-cell M2-defining signature expression level. Cells tend to cluster in subtypes of M2 macrophages of varying expression of the M2-defining macrophage signature. (C) High (n = 13) and low (n = 15) cohorts can be defined from our entire cohort. (D) High expression of M2-defining macrophage gene signature in M2 defined cells within peritoneal samples is associated with worse overall survival (p = 0.018). UMAP, unform manifold approximation and projection.

