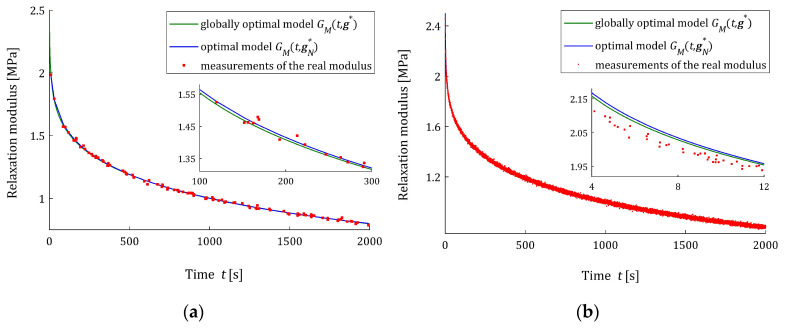
Figure 9.
The measurements (red points) of the real relaxation modulus (43) of the material described by the BSW spectrum (42) and the fractional Maxwell optimal models: sampling points-independent and empirical for measurements and additive random normally distributed noises with standard deviation and zero mean value: (a) ; (b) .

