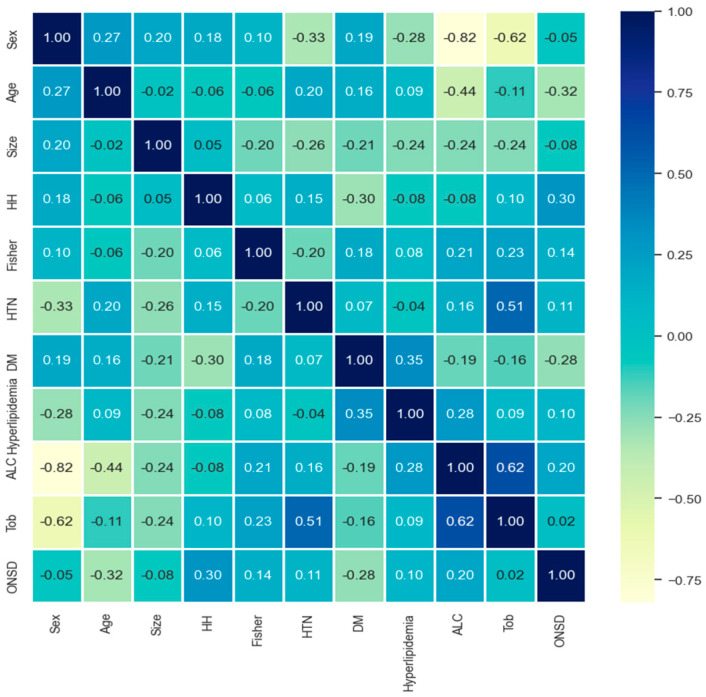
Figure 4.
Correlation analysis for prediction model (absolute value of the correlation coefficient: 0.8–1.0 highly, 0.6–0.8 strong, 0.4–0.6 medium, 0.2–0.4 weak, 0.0–0.2 weak or no correlation). Note: HH = Hunt–Hess grade, Fisher = Fisher grade; HTN = hypertension; DM = diabetes mellitus; ALC = alcohol abuse; Tob = tobacco, smoking behavior; ONSD = optic nerve sheath diameter.

