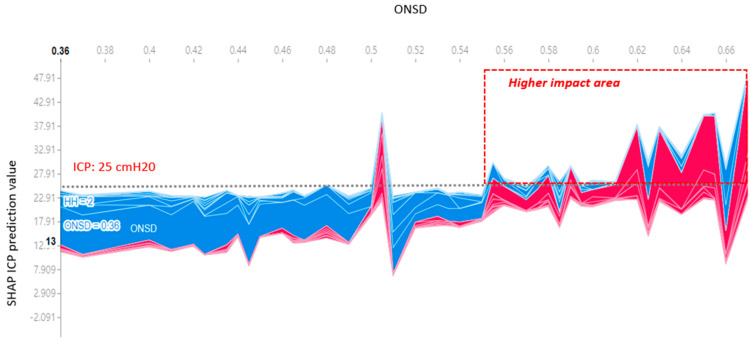
Figure 6.
The change in impact of ONSD in predicting ICP using the SHAP explainer is evident. As the ONSD width increases beyond 0.55 cm, there is a corresponding rise in ICP, elevating the SHAP value above the mean ICP of 25 cmH2O. Note: The highness or lowness of ICP prediction values = Red for high and blue for low.

