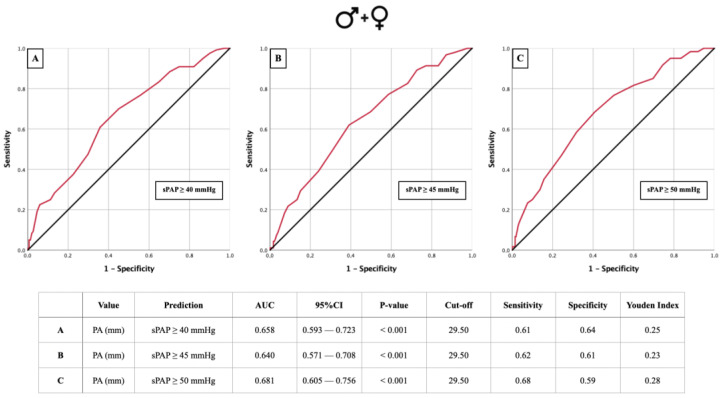
Figure 2.
AUROC curves and tabular overview of PA diameter values of the overall cohort (A–C) for the prediction of sPAP ≥ 40, 45, and 50 mmHg with cut-off values, sensitivity, specificity, and Youden indexes. PA = pulmonary artery; sPAP = systolic pulmonary artery pressure; AUC = area under the curve; CI = confidence interval.

