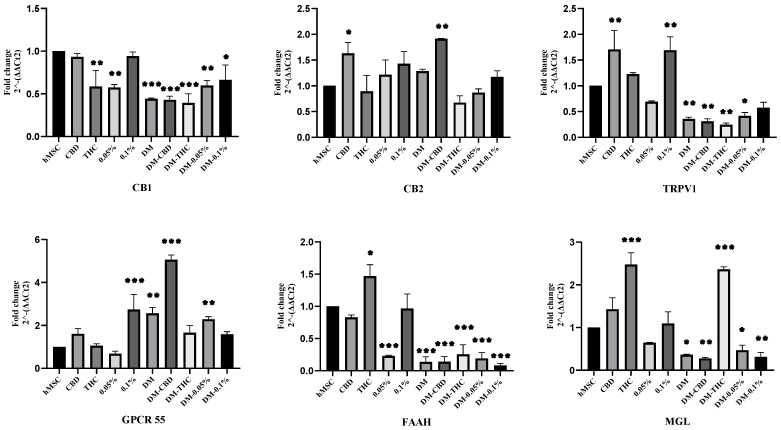
Figure 4.
Gene expression. mRNA levels of ECS genes (CB1, CB2, TRPV1, GPCR55, FAAH, and MGL) were investigated by quantitative RT-PCR after 72 h of culturing with CBD, THC, 0.05% HSO, or 0.1% HSO treatment with/out DM; the mean ± SD are shown; ANOVA compared to hMSC as * p ≤ 0.05, ** p ≤ 0.01, *** p ≤ 0.001.

