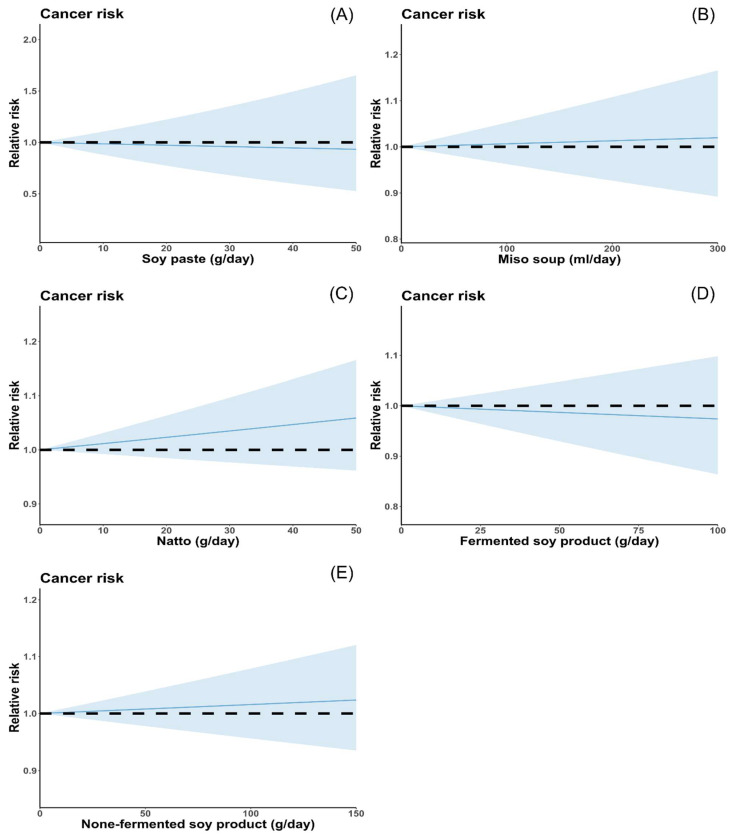
Figure 5.
Dose–response analysis of soy product and the risk of cancer: (A) Dose–response study of soy paste and cancer risk. (B) Dose–response analysis of natto and the risk of cancer. (C) Dose–response analysis of miso soup and the risk of cancer. (D) Dose–response analysis of fermented soy product and the risk of cancer. (E) Dose–response analysis of non-fermented soy product and the risk of cancer. Relative risks are indicated by solid lines, and the blue-shaded regions indicate the 95% confidence intervals.

