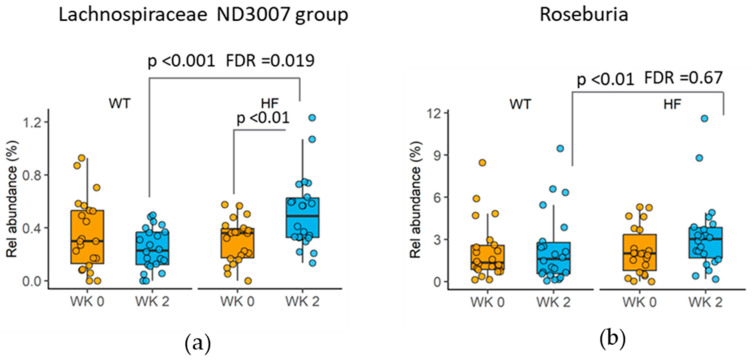
Figure 4.
Differences in faecal microbiome taxa at genus level between treatment groups (endpoint differences with FDR-adjusted p-values < 1 are shown). (a) Changes in the relative abundance of the Lachnospiraceae ND3007 group. (b) Changes in the relative abundance of Roseburia. Data (relative abundance) presented as medians and inter-quartile ranges (n = 22). p-values were from Wilcoxon signed-rank tests and following adjustment for false discovery rate (FDR) (Benjamini–Hochberg).

