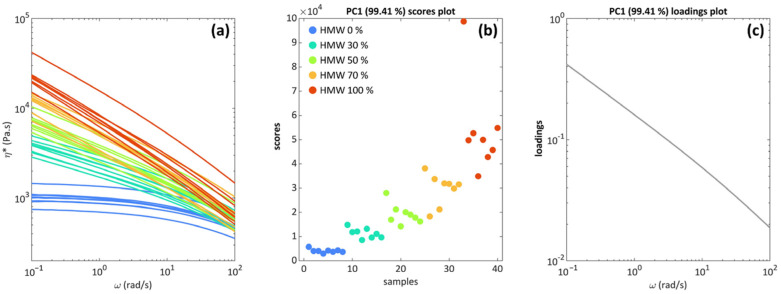
Figure 4.
(a) Viscosity curves (raw data), colored according to polymer concentrations; (b) PCA (Principal Component Analysis) score plot of PC1, colored according to polymer concentrations (“samples” refers to all blends compounded in different conditions); (c) PCA (Principal Component Analysis) loadings of PC1.

