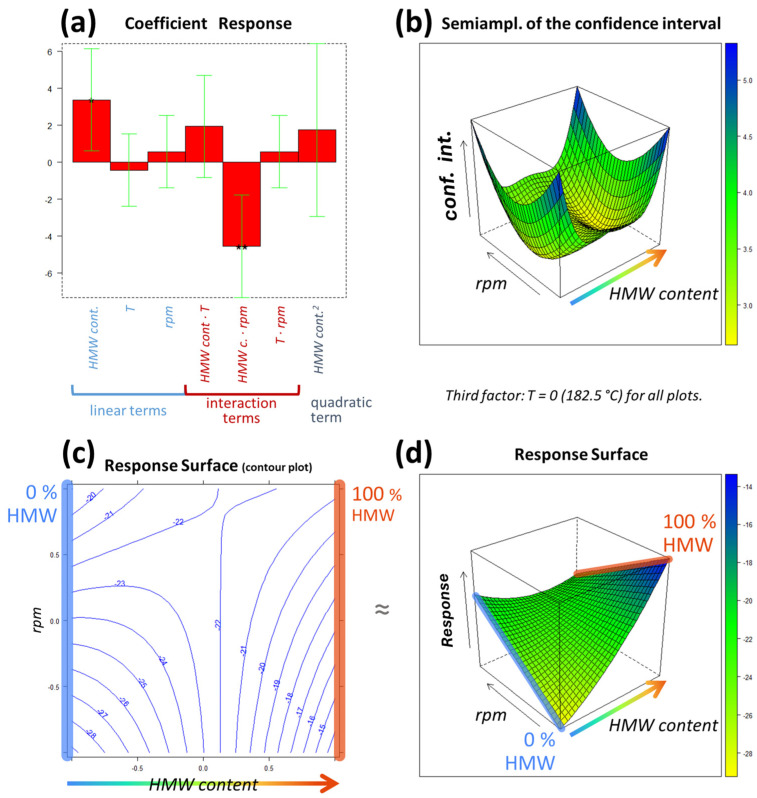
Figure 5.
The results of modeling the DoE (Design of Experiments) with MLR (multilinear regression). The experimental domain portion inspected in the figures corresponds to the only factors for which the coefficients resulted in significant results (HMW content and rpm), while the remaining one (T) was set to its central level (T = 182.5 °C). The regression coefficients are represented in (a), and the response surface is depicted in two dimensions ((c) a contour plot) and three dimensions (d). The confidence interval values corresponding to the response surface are reported in (b).

