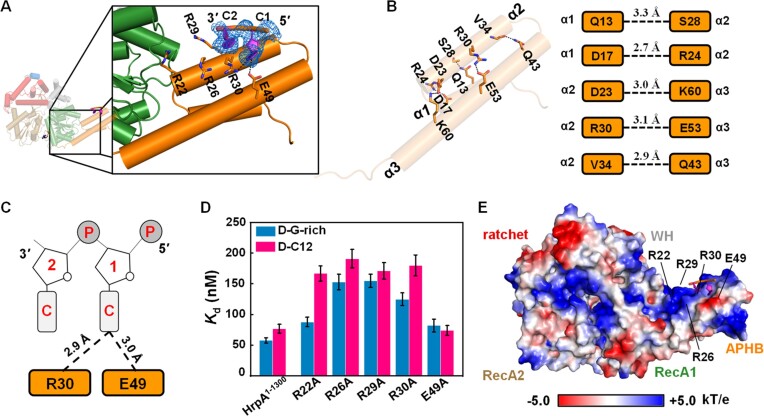
Figure 3.
The APHB domain shows functions in binding, ATPase, and helicase activities. (A) Structure of HrpA1–630• ADP•C2 complex. Detail interactions between APHB and DNA are shown in zoomed-in panels. The cartoon shows DNA with strong electron density (blue lines). (B) Interactions between helices of APHB domain in the structure of HrpA1–630• ADP•C2 complex. Hydrogen bonds are represented by the blue dashed line. (C) Schematic diagram of APHB’s contacts with two cytosine nucleotides. (D) Dissociation equilibrium constants of HrpA1–1300 and its variants to D-C12 and D-G-rich. (E) The electrostatic surface potential of HrpA1–630• ADP•C2 complex. Blue and red indicate positive and negative charges, respectively.

