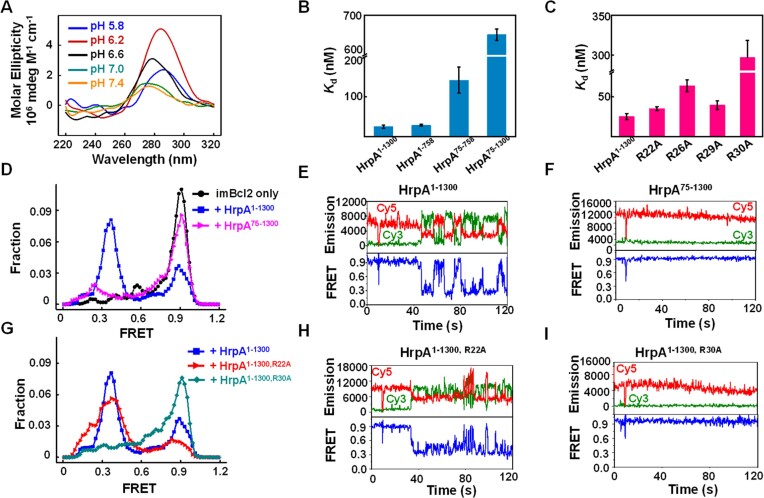
Figure 5.
Functional analysis of APHB in i-motif remodeling. (A) CD spectra of imBcl2 (3 μM) in a 50 mM sodium phosphate solution with 50 mM KCl at the required pH. (B, C) Dissociation equilibrium of HrpA1–1300, three truncations, and four point-mutations to Bcl2 i-motif (imBcl2). All assays were performed in 50 mM KCl and 50 mM PBS, pH 6.2. (D) FRET histograms were constructed from about 300 individual records of imBcl2 alone (imBcl2 only), imBcl2 with HrpA1–1300 and HrpA75–1300, respectively. Gaussian fittings yield two populations peaked at FRET = 0.39 and 0.89. (E, F) Individual FRET traces were recorded with 1 μM partial imBcl2 in the presence of HrpA1–1300 and HrpA75–1300. (G) FRET histograms were constructed from about 300 individual records of imBcl2 with HrpA1–1300, HrpA1–1300, R22A, and HrpA1–1300, R30A. Gaussian fittings yield two populations peaked at FRET = 0.39 and 0.89. (H, I) Individual FRET traces recorded with 1 μM partial

