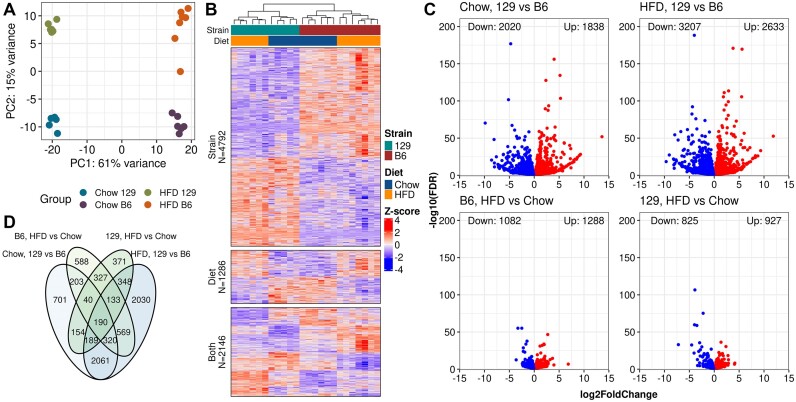
Figure 1.
Most of the differences in gene expression are observed between the strains. (A) Principal component analysis on genes with any reads (PC, principal component). (B) Heatmap of Z-scored VST-normalized gene expression counts for the DEGs observed in at least one comparison. Row splits are determined by the comparisons in which the DEG was observed (Strain: Only in strain, Diet: Only in diet, and Both: Both in diet and strain). Columns are clustered using Pearson correlation with complete linkage and rows are clustered by Pearson correlation within the splits. (C) Volcano plots for the DEGs by comparisons. (D) Venn diagram of DEG counts.

