Figure 3.
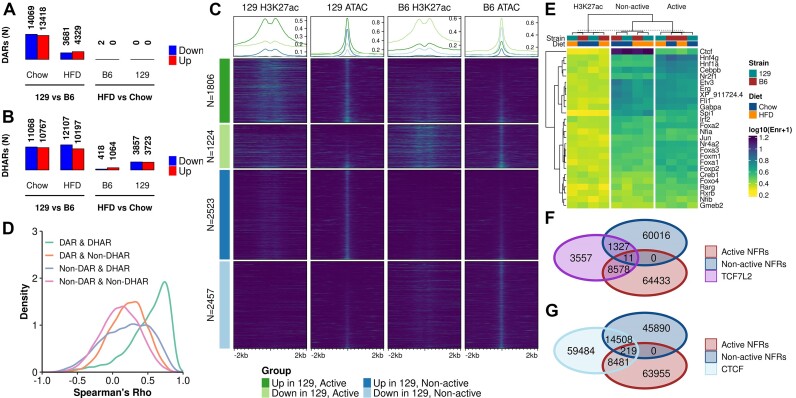
Differences in enhancer activity and accessibility between strains are dominant over diet-induced effects. (A) DAR (FDR < 0.001 and fold change > 50%) and (B) DHAR (FDR < 0.05) counts in the indicated comparisons. (C) Enrichment heatmap of ATAC-seq and H3K27ac signals at DARs observed between 129 and B6 mice on HFD. Rows are grouped to up and down differences between the strains at active and non-active regions. (D) Density plot of correlations between active NFRs (DARs and non-DARs) and the classes of histone acetylated regions of the H3K27ac valley summits (DHARs and non-DHARs). (E) Motif enrichment for group-wise active and non-active NFRs and H3K27Ac peaks. Heatmap columns and rows are clustered by Euclidean distance and columns are split using K-means clustering. Values shown are for the most significant motif for a given TF. Motifs for heatmap were selected by group-wise filtering of redundant motifs. (F, G) Venn diagrams of TCF7L2 (F) and CTCF (G) bound regions overlapping active and non-active NFRs.

