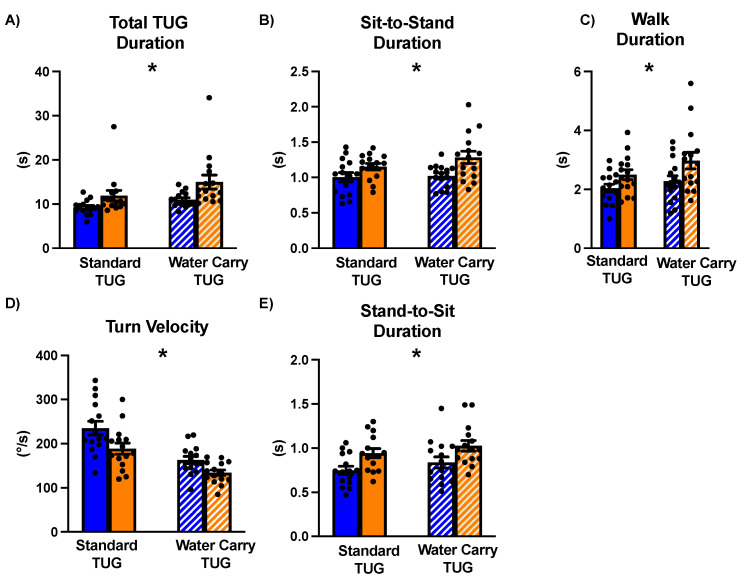
Figure 3.
Between-group differences in the standard and water-carry TUG assessments in people with and without essential tremor. (A) shows the total duration of each respective TUG, (B) displays the sit-to-stand phase, (C) represents the straight-line walk phase, (D) depicts the turn velocity in the turning phase, and (E) represents the stand-to-sit phase. The left side of the graphs indicates the standard TUG assessments, with solid blue bars indicating the non-ET group and solid orange bars indicating the ET group. The right side of the graphs indicates the water-carry TUG assessments, with striped, blue bars indicating the non-ET group and striped, orange bars indicating the ET group. Individual data points are shown as solid black circles. Standard error bars are also depicted. The main effect of the group is denoted by an asterisk (*).

