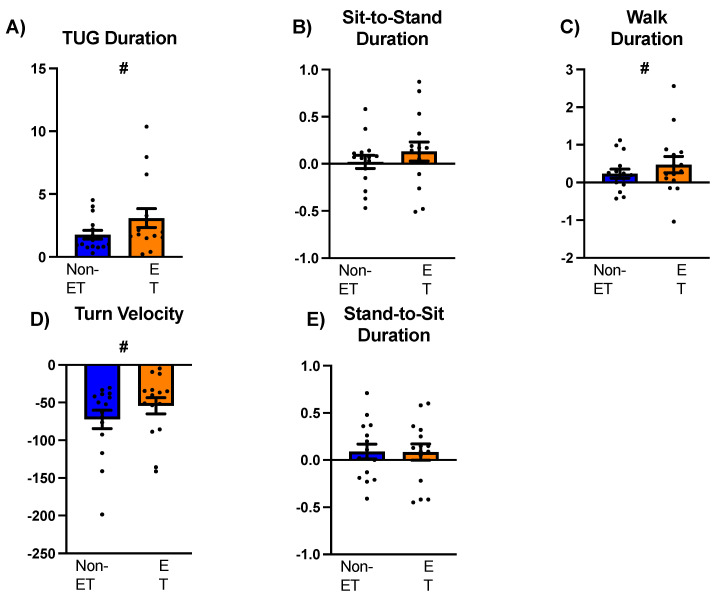
Figure 4.
A comparison of performance between standard and water-carry TUGs in individuals with and without essential tremor. Positive values indicate longer/faster performance during the water-carry TUG, while negative values indicate shorter/slower performance during the standard TUG. Panel (A): total TUG task duration, Panel (B): sit-to-stand phase, Panel (C): straight-line walk phase, Panel (D): turn velocity in the turning phase, and Panel (E): stand-to-sit phase. Blue bars represent the non-ET group, while orange bars represent the ET group. Black-filled circles indicate individual data points. Standard error bars are also depicted. The symbol # denotes the main effect of the condition.

