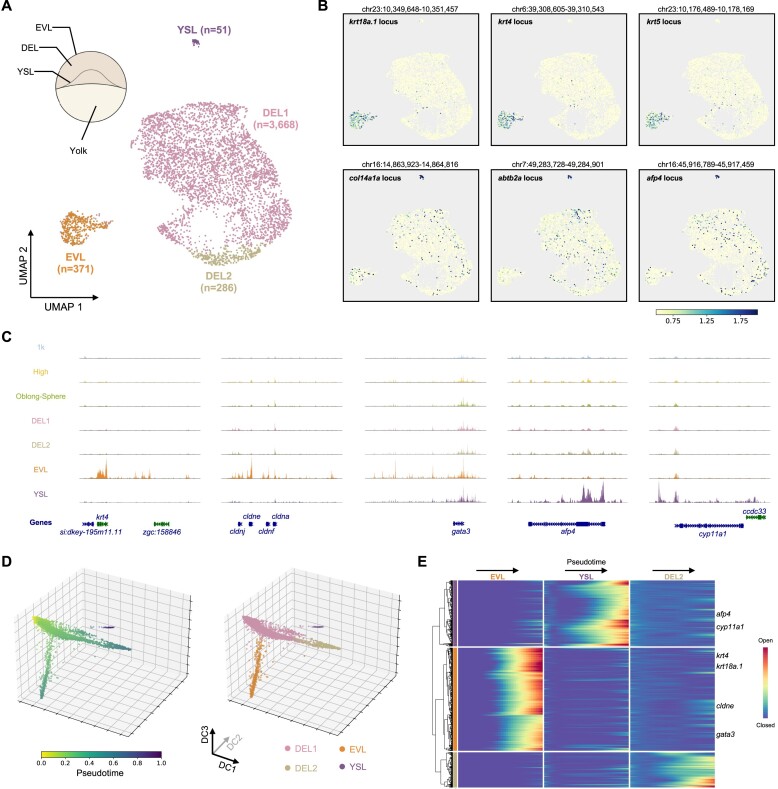
Figure 4.
Emerging different chromatin profiles among single cells when entering the dome stage. (A) UMAP visualisation of nucleus from the 4.1 hpf (sphere-dome) and the 4.3 hpf (dome) stages coloured by different clusters. Cluster annotations were indicated on the UMAP plot. A schematic view of the structure of the embryo was also shown at the top left. (B) The same UMAP plot as in (A), coloured by the normalised reads from the indicated gene locus. (C) Genome browser tracks showing the aggregated single-nucleus ATAC-seq signal from indicated cell clusters. Five examples were shown around the mark genes of EVL and YSL cells. (D) Diffusion pseudotime analysis of the nuclei from the 4.1 hpf (sphere-dome) and the 4.3 hpf (dome) stages, coloured by the pseudotime (left) or cell identity (right). (E) Heatmap representation of gene activity changes along three different branches. Important marker genes for EVL and YSL cells were indicated.

